T isted below are sysdolic blood pressure measurements (in mm Hg) oblained trom the same woman Find the regression qualion, letting the right sm blood pressure be ihe prdictor (x) variable Find the best predickd rilk Data Table Right Arm Left Arm 103 102 94 76 76 O 175 169 149 150 148 E Click the icon to view the crilitzal values of the Pearson conelialion coethcient i Crilical Vaks of the Pearson Correlation Cillkntr The regression equalion is y= (Rund to one decimal place as needed) NOTE To test H =0 aganst H,p/0, rejed l, if the absolute =0.05 0.960 u-0.01 0.990 0.878 O811 0./54 0.707 0 81/ 0.875 O 034 value of r is grealer than the cntical value in the table Givin Ihal Ihe systolic blood pressure in the right arn in 90 mm Hg, the best predictod systolic blood pressure in the kefl arm is (Round to one decimal plare as needed.) 9. 0.798


Permutations and Combinations
If there are 5 dishes, they can be relished in any order at a time. In permutation, it should be in a particular order. In combination, the order does not matter. Take 3 letters a, b, and c. The possible ways of pairing any two letters are ab, bc, ac, ba, cb and ca. It is in a particular order. So, this can be called the permutation of a, b, and c. But if the order does not matter then ab is the same as ba. Similarly, bc is the same as cb and ac is the same as ca. Here the list has ab, bc, and ac alone. This can be called the combination of a, b, and c.
Counting Theory
The fundamental counting principle is a rule that is used to count the total number of possible outcomes in a given situation.
Please answer all questions a-e
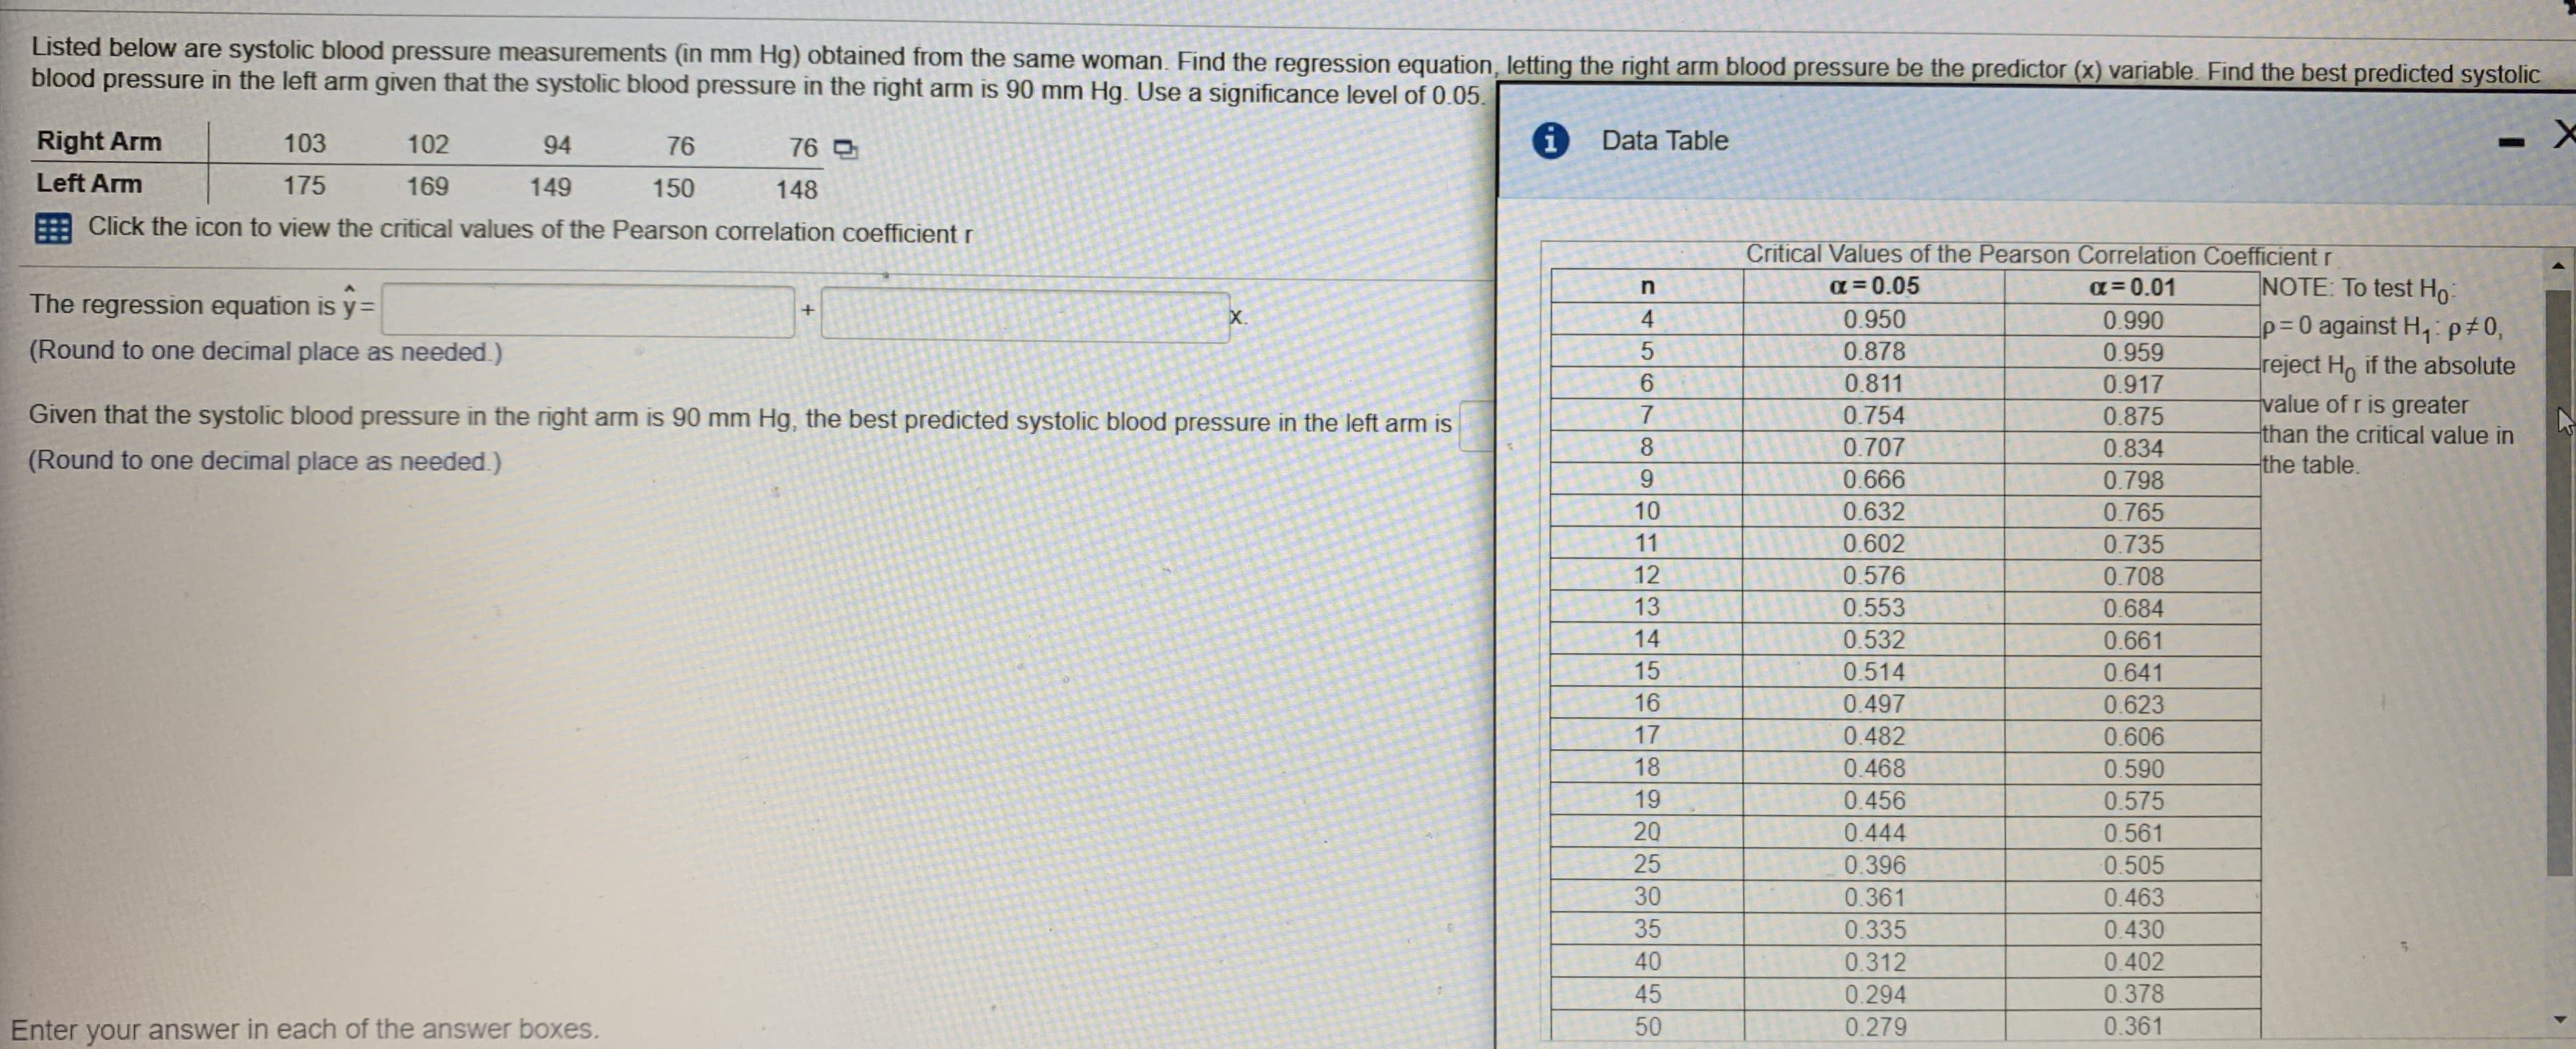
Use EXCEL to construct the regression between the right arm and left arm.
EXCEL procedure:
- Go to EXCEL
- Go to Data>Data Analysis.
- Choose Regression.
- Input Y range as $B$1:$B$6.
- Input X range as $A$1:$A$6.
- Check the option Labels in First row.
- Click OK.
EXCEL output:
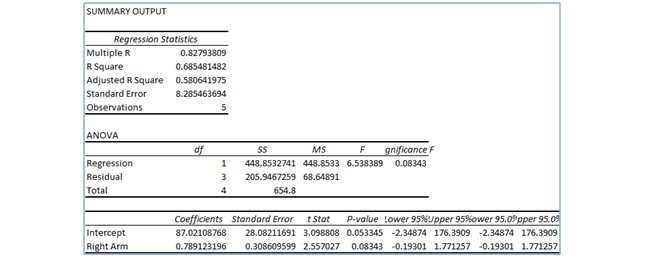
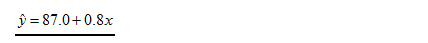
EXCEL output, the regression equation is as follows:

Trending now
This is a popular solution!

Step by step
Solved in 2 steps with 3 images


