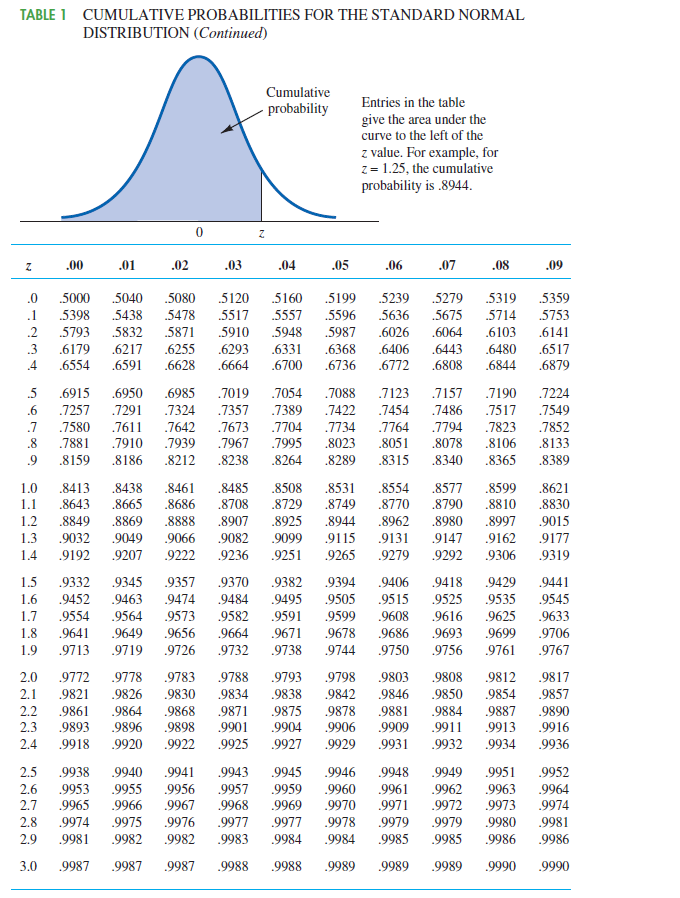
TABLE 1 CUMULATIVE PROBABILITIES FOR THE STANDARD NORMAL DISTRIBUTION (Continued) Cumulative Entries in the table give the area under the curve to the left of the z value. For example, for z= 1.25, the cumulative probability is .8944. probability .00 .01 .02 .03 .04 .05 .06 .07 .08 .09 5080 5120 5517 .0 5000 .5040 .5160 .5199 .5239 .5279 .5319 .5359 5714 .6103 .1 .5398 .5438 .5478 .5557 .5596 .5636 .5675 .5753 .2 5793 .5832 .5871 .5910 .5948 .5987 .6026 .6064 .6141 .3 .6179 .6217 .6255 .6293 .6331 .6368 .6406 .6443 .6480 .6517 .4 .6554 .6591 .6628 .6664 .6700 .6736 .6772 .6808 .6844 .6879 .5 .6915 .6950 .6985 .7019 .7054 .7088 7123 .7157 .7190 .7224 .6 .7257 .7291 .7324 .7357 .7389 .7422 .7454 .7486 .7517 .7549 .7611 .7910 .7 .7580 .7642 .7673 .7704 .7734 .7764 .7794 .7823 .7852 .8 .7881 .7939 .7967 .7995 .8023 .8051 .8078 8106 .8133 .9 .8159 .8186 .8212 .8238 .8264 .8289 .8315 .8340 .8365 .8389 .8413 .8643 1.0 .8438 .8461 .8485 .8508 .8531 .8554 .8577 .8599 .8621 1.1 .8665 .8686 .8708 .8729 .8749 .8770 .8790 .8810 .8830 1.2 .8849 .8869 .8888 .8907 .8925 .8944 .8962 .8980 .8997 .9015 1.3 .9032 .9049 .9066 .9082 .9099 .9115 .9131 .9147 .9162 .9177 1.4 .9192 9207 .9222 .9236 .9251 .9265 .9279 .9292 .9306 .9319 1.5 .9332 .9345 .9357 .9370 .9382 .9394 .9406 .9418 .9429 .9441 1.6 .9452 .9463 .9474 .9484 .9495 .9505 .9515 .9525 .9535 .9545 .9582 .9664 .9633 .9706 1.7 .9554 .9564 .9573 .9591 .9599 .9608 .9616 .9625 1.8 .9641 .9649 .9656 .9671 .9678 .9686 .9693 .9699 1.9 .9713 .9719 .9726 .9732 .9738 .9744 .9750 .9756 .9761 .9767 2.0 .9772 .9778 .9783 .9788 .9793 .9798 .9803 .9808 .9812 .9817 2.1 .9821 .9826 .9830 .9834 .9838 .9842 .9846 .9850 .9854 .9857 .9884 .9911 .9890 .9916 2.2 .9861 .9864 .9868 .9871 .9875 .9878 .9881 .9887 2.3 .9893 .9896 .9898 .9901 .9904 .9906 .9909 .9913 2.4 .9918 .9920 .9922 .9925 .9927 .9929 .9931 .9932 .9934 .9936 2.5 .9938 .9940 .9941 .9943 .9945 .9946 .9948 .9949 .9951 .9952 .9961 .9971 2.6 .9953 .9965 .9955 .9956 .9967 .9957 .9959 .9960 .9962 .9963 .9964 .9972 .9979 2.7 .9966 .9968 .9969 .9970 .9973 .9974 .9977 .9983 2.8 .9974 .9975 .9976 .9977 .9978 .9979 .9980 .9981 2.9 .9981 .9982 .9982 .9984 .9984 .9985 .9985 .9986 .9986 3.0 .9987 .9987 .9987 .9988 .9988 .9989 .9989 .9989 .9990 .9990
TABLE 1 CUMULATIVE PROBABILITIES FOR THE STANDARD NORMAL DISTRIBUTION (Continued) Cumulative Entries in the table give the area under the curve to the left of the z value. For example, for z= 1.25, the cumulative probability is .8944. probability .00 .01 .02 .03 .04 .05 .06 .07 .08 .09 5080 5120 5517 .0 5000 .5040 .5160 .5199 .5239 .5279 .5319 .5359 5714 .6103 .1 .5398 .5438 .5478 .5557 .5596 .5636 .5675 .5753 .2 5793 .5832 .5871 .5910 .5948 .5987 .6026 .6064 .6141 .3 .6179 .6217 .6255 .6293 .6331 .6368 .6406 .6443 .6480 .6517 .4 .6554 .6591 .6628 .6664 .6700 .6736 .6772 .6808 .6844 .6879 .5 .6915 .6950 .6985 .7019 .7054 .7088 7123 .7157 .7190 .7224 .6 .7257 .7291 .7324 .7357 .7389 .7422 .7454 .7486 .7517 .7549 .7611 .7910 .7 .7580 .7642 .7673 .7704 .7734 .7764 .7794 .7823 .7852 .8 .7881 .7939 .7967 .7995 .8023 .8051 .8078 8106 .8133 .9 .8159 .8186 .8212 .8238 .8264 .8289 .8315 .8340 .8365 .8389 .8413 .8643 1.0 .8438 .8461 .8485 .8508 .8531 .8554 .8577 .8599 .8621 1.1 .8665 .8686 .8708 .8729 .8749 .8770 .8790 .8810 .8830 1.2 .8849 .8869 .8888 .8907 .8925 .8944 .8962 .8980 .8997 .9015 1.3 .9032 .9049 .9066 .9082 .9099 .9115 .9131 .9147 .9162 .9177 1.4 .9192 9207 .9222 .9236 .9251 .9265 .9279 .9292 .9306 .9319 1.5 .9332 .9345 .9357 .9370 .9382 .9394 .9406 .9418 .9429 .9441 1.6 .9452 .9463 .9474 .9484 .9495 .9505 .9515 .9525 .9535 .9545 .9582 .9664 .9633 .9706 1.7 .9554 .9564 .9573 .9591 .9599 .9608 .9616 .9625 1.8 .9641 .9649 .9656 .9671 .9678 .9686 .9693 .9699 1.9 .9713 .9719 .9726 .9732 .9738 .9744 .9750 .9756 .9761 .9767 2.0 .9772 .9778 .9783 .9788 .9793 .9798 .9803 .9808 .9812 .9817 2.1 .9821 .9826 .9830 .9834 .9838 .9842 .9846 .9850 .9854 .9857 .9884 .9911 .9890 .9916 2.2 .9861 .9864 .9868 .9871 .9875 .9878 .9881 .9887 2.3 .9893 .9896 .9898 .9901 .9904 .9906 .9909 .9913 2.4 .9918 .9920 .9922 .9925 .9927 .9929 .9931 .9932 .9934 .9936 2.5 .9938 .9940 .9941 .9943 .9945 .9946 .9948 .9949 .9951 .9952 .9961 .9971 2.6 .9953 .9965 .9955 .9956 .9967 .9957 .9959 .9960 .9962 .9963 .9964 .9972 .9979 2.7 .9966 .9968 .9969 .9970 .9973 .9974 .9977 .9983 2.8 .9974 .9975 .9976 .9977 .9978 .9979 .9980 .9981 2.9 .9981 .9982 .9982 .9984 .9984 .9985 .9985 .9986 .9986 3.0 .9987 .9987 .9987 .9988 .9988 .9989 .9989 .9989 .9990 .9990

MATLAB: An Introduction with Applications
6th Edition
ISBN:9781119256830
Author:Amos Gilat
Publisher:Amos Gilat
Chapter1: Starting With Matlab
Section: Chapter Questions
Problem 1P

Related questions
Topic Video
Question
A population has a mean of 300 and a standard deviation of 60. Suppose a sample of size 100 is selected x bar and mean is used to estimate . Use z-table.
- What is the probability that the sample mean will be within +/- 5 of the population mean (to 4 decimals)? (Round z value in intermediate calculations to 2 decimal places.)
- What is the probability that the sample mean will be within +/- 17 of the population mean (to 4 decimals)? (Round z value in intermediate calculations to 2 decimal places.)
Transcribed Image Text:TABLE 1 CUMULATIVE PROBABILITIES FOR THE STANDARD NORMAL
DISTRIBUTION (Continued)
Cumulative
Entries in the table
give the area under the
curve to the left of the
z value. For example, for
z= 1.25, the cumulative
probability is .8944.
probability
.00
.01
.02
.03
.04
.05
.06
.07
.08
.09
5080
5120
5517
.0
5000
.5040
.5160
.5199
.5239
.5279
.5319
.5359
5714
.6103
.1
.5398
.5438
.5478
.5557
.5596
.5636
.5675
.5753
.2
5793
.5832
.5871
.5910
.5948
.5987
.6026
.6064
.6141
.3
.6179
.6217
.6255
.6293
.6331
.6368
.6406
.6443
.6480
.6517
.4
.6554
.6591
.6628
.6664
.6700
.6736
.6772
.6808
.6844
.6879
.5
.6915
.6950
.6985
.7019
.7054
.7088
7123
.7157
.7190
.7224
.6
.7257
.7291
.7324
.7357
.7389
.7422
.7454
.7486
.7517
.7549
.7611
.7910
.7
.7580
.7642
.7673
.7704
.7734
.7764
.7794
.7823
.7852
.8
.7881
.7939
.7967
.7995
.8023
.8051
.8078
8106
.8133
.9
.8159
.8186
.8212
.8238
.8264
.8289
.8315
.8340
.8365
.8389
.8413
.8643
1.0
.8438
.8461
.8485
.8508
.8531
.8554
.8577
.8599
.8621
1.1
.8665
.8686
.8708
.8729
.8749
.8770
.8790
.8810
.8830
1.2
.8849
.8869
.8888
.8907
.8925
.8944
.8962
.8980
.8997
.9015
1.3
.9032
.9049
.9066
.9082
.9099
.9115
.9131
.9147
.9162
.9177
1.4
.9192
9207
.9222
.9236
.9251
.9265
.9279
.9292
.9306
.9319
1.5
.9332
.9345
.9357
.9370
.9382
.9394
.9406
.9418
.9429
.9441
1.6
.9452
.9463
.9474
.9484
.9495
.9505
.9515
.9525
.9535
.9545
.9582
.9664
.9633
.9706
1.7
.9554
.9564
.9573
.9591
.9599
.9608
.9616
.9625
1.8
.9641
.9649
.9656
.9671
.9678
.9686
.9693
.9699
1.9
.9713
.9719
.9726
.9732
.9738
.9744
.9750
.9756
.9761
.9767
2.0
.9772
.9778
.9783
.9788
.9793
.9798
.9803
.9808
.9812
.9817
2.1
.9821
.9826
.9830
.9834
.9838
.9842
.9846
.9850
.9854
.9857
.9884
.9911
.9890
.9916
2.2
.9861
.9864
.9868
.9871
.9875
.9878
.9881
.9887
2.3
.9893
.9896
.9898
.9901
.9904
.9906
.9909
.9913
2.4
.9918
.9920
.9922
.9925
.9927
.9929
.9931
.9932
.9934
.9936
2.5
.9938
.9940
.9941
.9943
.9945
.9946
.9948
.9949
.9951
.9952
.9961
.9971
2.6
.9953
.9965
.9955
.9956
.9967
.9957
.9959
.9960
.9962
.9963
.9964
.9972
.9979
2.7
.9966
.9968
.9969
.9970
.9973
.9974
.9977
.9983
2.8
.9974
.9975
.9976
.9977
.9978
.9979
.9980
.9981
2.9
.9981
.9982
.9982
.9984
.9984
.9985
.9985
.9986
.9986
3.0
.9987
.9987
.9987
.9988
.9988
.9989
.9989
.9989
.9990
.9990
Expert Solution
This question has been solved!
Explore an expertly crafted, step-by-step solution for a thorough understanding of key concepts.

This is a popular solution!

Trending now
This is a popular solution!

Step by step
Solved in 2 steps with 5 images

Knowledge Booster


Learn more about
Need a deep-dive on the concept behind this application? Look no further. Learn more about this topic, statistics and related others by exploring similar questions and additional content below.Recommended textbooks for you
MATLAB: An Introduction with Applications
Statistics
ISBN:
9781119256830
Author:
Amos Gilat
Publisher:
John Wiley & Sons Inc

Probability and Statistics for Engineering and th…
Statistics
ISBN:
9781305251809
Author:
Jay L. Devore
Publisher:
Cengage Learning

Statistics for The Behavioral Sciences (MindTap C…
Statistics
ISBN:
9781305504912
Author:
Frederick J Gravetter, Larry B. Wallnau
Publisher:
Cengage Learning
MATLAB: An Introduction with Applications
Statistics
ISBN:
9781119256830
Author:
Amos Gilat
Publisher:
John Wiley & Sons Inc
Probability and Statistics for Engineering and th…
Statistics
ISBN:
9781305251809
Author:
Jay L. Devore
Publisher:
Cengage Learning
Statistics for The Behavioral Sciences (MindTap C…
Statistics
ISBN:
9781305504912
Author:
Frederick J Gravetter, Larry B. Wallnau
Publisher:
Cengage Learning

Elementary Statistics: Picturing the World (7th E…
Statistics
ISBN:
9780134683416
Author:
Ron Larson, Betsy Farber
Publisher:
PEARSON

The Basic Practice of Statistics
Statistics
ISBN:
9781319042578
Author:
David S. Moore, William I. Notz, Michael A. Fligner
Publisher:
W. H. Freeman

Introduction to the Practice of Statistics
Statistics
ISBN:
9781319013387
Author:
David S. Moore, George P. McCabe, Bruce A. Craig
Publisher:
W. H. Freeman