Table 1: Demand for Dog Ball Launcher 2018-2021 Quarter 2018 Demand 2019 Demand Q1 02 03 Q4 Month January February March April May June July 10 29 26 15 August September October November December Table 2: Demand for Lightweight Dog Lead 2020-2021 2020 Demand 2021 Demand 36 56 75 85 94 101 108 14 31 29 18 105 114 111 110 2020 Demand 20 26 28 30 98 101 97 99 100 95 107 104 98 104 100 102 2021 Demand 30 31 33 35
Table 1: Demand for Dog Ball Launcher 2018-2021 Quarter 2018 Demand 2019 Demand Q1 02 03 Q4 Month January February March April May June July 10 29 26 15 August September October November December Table 2: Demand for Lightweight Dog Lead 2020-2021 2020 Demand 2021 Demand 36 56 75 85 94 101 108 14 31 29 18 105 114 111 110 2020 Demand 20 26 28 30 98 101 97 99 100 95 107 104 98 104 100 102 2021 Demand 30 31 33 35

Purchasing and Supply Chain Management
6th Edition
ISBN:9781285869681
Author:Robert M. Monczka, Robert B. Handfield, Larry C. Giunipero, James L. Patterson
Publisher:Robert M. Monczka, Robert B. Handfield, Larry C. Giunipero, James L. Patterson
ChapterC: Cases
Section: Chapter Questions
Problem 5.1SD: Scenario 4 Sharon Gillespie, a new buyer at Visionex, Inc., was reviewing quotations for a tooling...

Related questions
Question
See attached file need correct excel answer of data thank you.
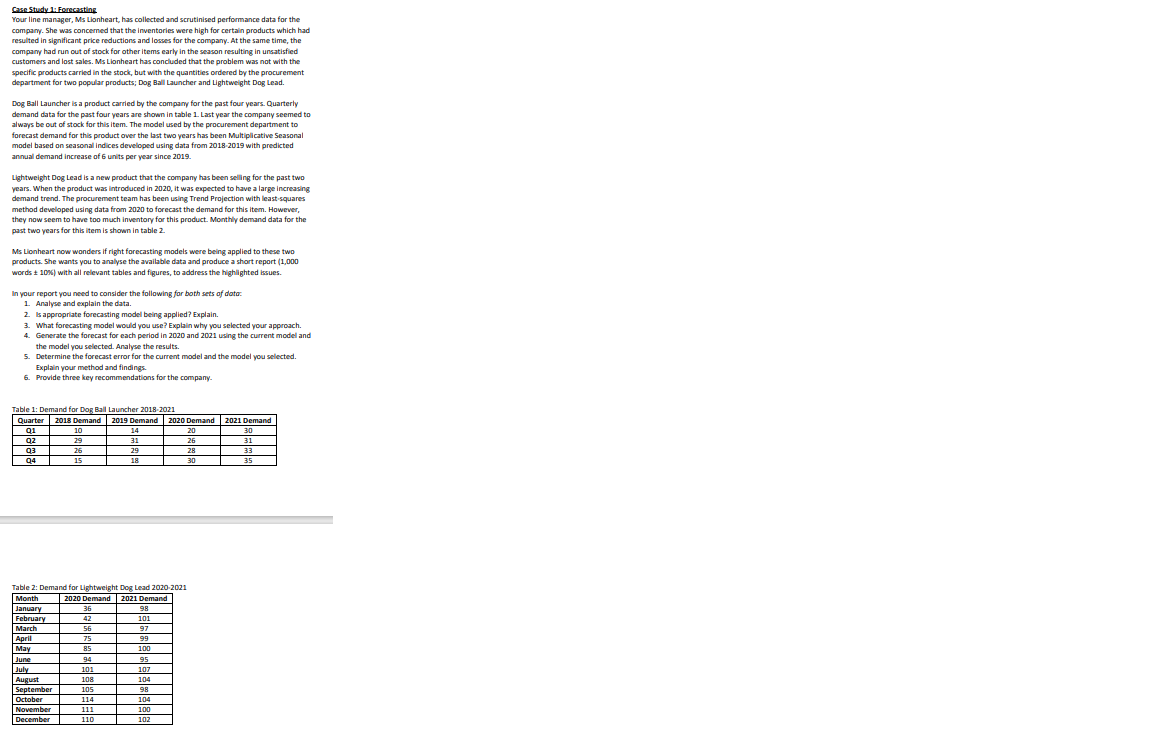
Transcribed Image Text:Case Study 1: Forecasting
Your line manager, Ms Lionheart, has collected and scrutinised performance data for the
company. She was concerned that the inventories were high for certain products which had
resulted in
din significant price reductions and losses for the company. At the same time, the
company had run out of stock for other items early in the season resulting in unsatisfied
customers and lost sales. Ms Lionheart has concluded that the problem was not with the
specific products carried in the stock, but with the quantities ordered by the procurement
department for two popular products; Dog Ball Launcher and Lightweight Dog Lead.
Dog Ball Launcher is a product carried by the company for the past four years. Quarterly
demand data for the past four years are shown in table 1. Last year the company seemed to
always be out of stock for this item. The model used by the procurement department to
forecast demand for this product over the last two years has been Multiplicative Seasonal
model based on seasonal indices developed using data from 2018-2019 with predicted
annual demand increase of 6 units per year since 2019.
Lightweight Dog Lead is a new product that the company has been selling for the past two
years. When the product was introduced in 2020, it was expected to have a large increasing
demand trend. The procurement team has been using Trend Projection with least-squares
method developed using data from 2020 to forecast the demand for this item. However,
they now seem to have too much inventory for this product. Monthly demand data for the
past two years for this item is shown in table 2.
Ms Lionheart now wonders if right forecasting models were being applied to these two
products. She wants you to analyse the available data and produce a short report (1,000
words ±10%) with all relevant tables and figures, to address the highlighted issues.
In your report you need to consider the following for both sets of data:
1. Analyse and explain the data.
2. Is appropriate forecasting model being applied? Explain.
3. What forecasting model would you use? Explain why you selected your approach.
4. Generate the forecast for each period in 2020 and 2021 using the current model and
the model you selected. Analyse the results.
5. Determine the forecast error for the current model and the model you selected.
Explain your method and findings
6. Provide three key recommendations for the company.
Table 1: Demand for Dog Ball Launcher 2018-2021
Quarter 2018 Demand 2019 Demand 2020 Demand 2021 Demand
Q1
02
Q3
04
March
April
May
June
July
10
29
26
15
Table 2: Demand for Lightweight Dog Lead 2020-2021
Month
January
2020 Demand 2021 Demand
36
98
February
42
101
56
97
99
100
95
107
104
98
104
August
September
October
Nouemb
November
December
75
85
14
31
29
18
94
101
108
105
114
111
110
20
26
28
30
100
102
30
31
33
35
Expert Solution
This question has been solved!
Explore an expertly crafted, step-by-step solution for a thorough understanding of key concepts.

Step by step
Solved in 4 steps with 7 images

Follow-up Questions
Read through expert solutions to related follow-up questions below.
Follow-up Question
how would you calculate the
Solution
Recommended textbooks for you
Purchasing and Supply Chain Management
Operations Management
ISBN:
9781285869681
Author:
Robert M. Monczka, Robert B. Handfield, Larry C. Giunipero, James L. Patterson
Publisher:
Cengage Learning
Purchasing and Supply Chain Management
Operations Management
ISBN:
9781285869681
Author:
Robert M. Monczka, Robert B. Handfield, Larry C. Giunipero, James L. Patterson
Publisher:
Cengage Learning