Table 9.2 Average Returns for Bonds 1950 to 1959 1960 to 1969 1970 to 1979 1980 to 1989 1990 to 1999 2000 to 2009 1950 to 1959 1960 to 1969 1970 to 1979 1980 to 1989 1990 to 1999 2000 to 2009 Average Average Average Average Average Average Decade Table 9.4 Annual Standard Deviation for Bonds 1960s 1970s 1980s 1990s 2000s Long-Term Treasury Bonds COV 0.08 1.9 Long-Term Treasury Bonds 4.9% 6.1 6.6 15.5 5.7 13.8 9.2 8.6 12.6 10.3 Use the tables above to calculate the coefficient of variation of the risk-return relationship of the bond market during each decade since 1950. (Round your answers to 2 decimal places.)
Table 9.2 Average Returns for Bonds 1950 to 1959 1960 to 1969 1970 to 1979 1980 to 1989 1990 to 1999 2000 to 2009 1950 to 1959 1960 to 1969 1970 to 1979 1980 to 1989 1990 to 1999 2000 to 2009 Average Average Average Average Average Average Decade Table 9.4 Annual Standard Deviation for Bonds 1960s 1970s 1980s 1990s 2000s Long-Term Treasury Bonds COV 0.08 1.9 Long-Term Treasury Bonds 4.9% 6.1 6.6 15.5 5.7 13.8 9.2 8.6 12.6 10.3 Use the tables above to calculate the coefficient of variation of the risk-return relationship of the bond market during each decade since 1950. (Round your answers to 2 decimal places.)

Pfin (with Mindtap, 1 Term Printed Access Card) (mindtap Course List)
7th Edition
ISBN:9780357033609
Author:Randall Billingsley, Lawrence J. Gitman, Michael D. Joehnk
Publisher:Randall Billingsley, Lawrence J. Gitman, Michael D. Joehnk
Chapter12: Investing In Stocks And Bonds
Section: Chapter Questions
Problem 9FPE: Which of these two bonds offers the highest current yield? Which one has the highest yield to...

Related questions
Question
Please help and I'll rate you correctly thanks
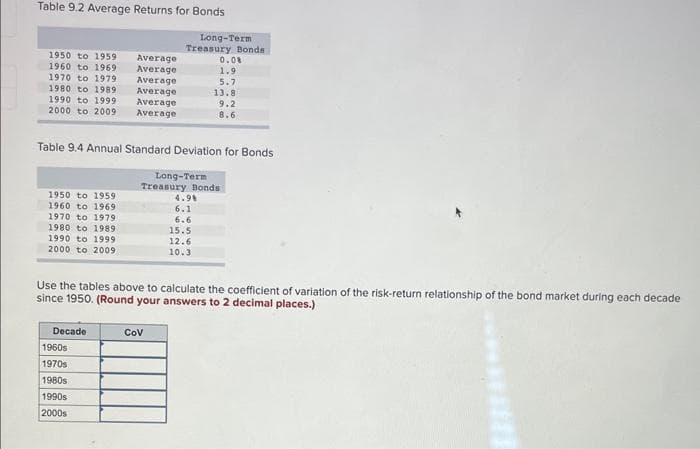
Transcribed Image Text:Table 9.2 Average Returns for Bonds
1950 to 1959
1960 to 1969
1970 to 1979
1980 to 1989
1990 to 1999
2000 to 2009
1950 to 1959
1960 to 1969
1970 to 1979
1980 to 1989
1990 to 1999
2000 to 2009
Table 9.4 Annual Standard Deviation for Bonds
Decade
Average
Average
1960s
1970s
Average
Average
Average
Average
1980s
1990s
2000s
Long-Term
Treasury Bonds
0.08
1.9
5.7
13.8
9.2
8.6
Long-Term
Treasury Bonds
Use the tables above to calculate the coefficient of variation of the risk-return relationship of the bond market during each decade
since 1950. (Round your answers to 2 decimal places.)
COV
4.98
6.1
6.6
15.5
12.6
10.3
Expert Solution
This question has been solved!
Explore an expertly crafted, step-by-step solution for a thorough understanding of key concepts.

This is a popular solution!

Trending now
This is a popular solution!

Step by step
Solved in 3 steps with 3 images

Knowledge Booster


Learn more about
Need a deep-dive on the concept behind this application? Look no further. Learn more about this topic, finance and related others by exploring similar questions and additional content below.Recommended textbooks for you
Pfin (with Mindtap, 1 Term Printed Access Card) (…
Finance
ISBN:
9780357033609
Author:
Randall Billingsley, Lawrence J. Gitman, Michael D. Joehnk
Publisher:
Cengage Learning


Pfin (with Mindtap, 1 Term Printed Access Card) (…
Finance
ISBN:
9780357033609
Author:
Randall Billingsley, Lawrence J. Gitman, Michael D. Joehnk
Publisher:
Cengage Learning

Excel Applications for Accounting Principles
Accounting
ISBN:
9781111581565
Author:
Gaylord N. Smith
Publisher:
Cengage Learning