Tensen Tire & Auto IS in the process of deciding whether machine. Managers feel that maintenance expense should be related to usage, and they collected the following information on weekly usage (hours) and annual maintenance expense (in hundreds of dollars). Weekly Usage Annual (hours) Maintenance Expense 16 18 13 23 23 31 31 38 35 48 20 32 27 34 34 40 43 53 41 41 a. Develop the estimated regression equation that relates annual maintenance expense (in hundreds to weekly usage hours (to 3 decimals). Expense Weekly Usage b. Test the significance of the relationship in part (a) at a 0.05 level of significance.
Tensen Tire & Auto IS in the process of deciding whether machine. Managers feel that maintenance expense should be related to usage, and they collected the following information on weekly usage (hours) and annual maintenance expense (in hundreds of dollars). Weekly Usage Annual (hours) Maintenance Expense 16 18 13 23 23 31 31 38 35 48 20 32 27 34 34 40 43 53 41 41 a. Develop the estimated regression equation that relates annual maintenance expense (in hundreds to weekly usage hours (to 3 decimals). Expense Weekly Usage b. Test the significance of the relationship in part (a) at a 0.05 level of significance.

Glencoe Algebra 1, Student Edition, 9780079039897, 0079039898, 2018
18th Edition
ISBN:9780079039897
Author:Carter
Publisher:Carter
Chapter4: Equations Of Linear Functions
Section4.6: Regression And Median-fit Lines
Problem 4GP

Related questions
Question
3
Transcribed Image Text:41
41
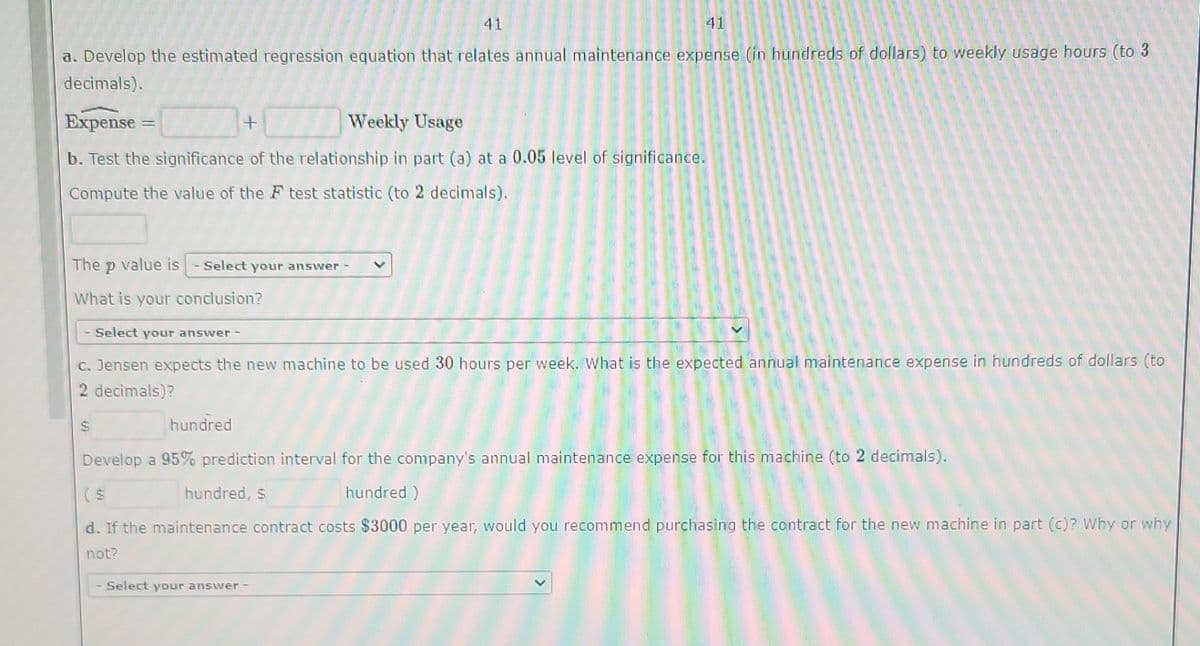
a. Develop the estimated regression equation that relates annual maintenance expense (in hundreds of dollars) to weekly usage hours (to 3
decimals).
Expense
Weekly Usage
b. Test the significance of the relationship in part (a) at a 0.05 level of significance.
Compute the value of the F test statistic (to 2 decimals).
The p value is
- Select your answer -
What is your conclusion?
Select your answer -
C. Jensen expects the new machine to be used 30 hours per week. What is the expected annual maintenance expense in hundreds of dollars (to
2 decimals)?
hundred
Develop a 95% prediction interval for the company's annual maintenance expense for this machine (to 2 decimals).
(S
hundred, s
hundred )
d. If the maintenance contract costs $3000 per year, would you recommend purchasing the contract for the new machine in part (c)? Why or why
not?
Select your answer-
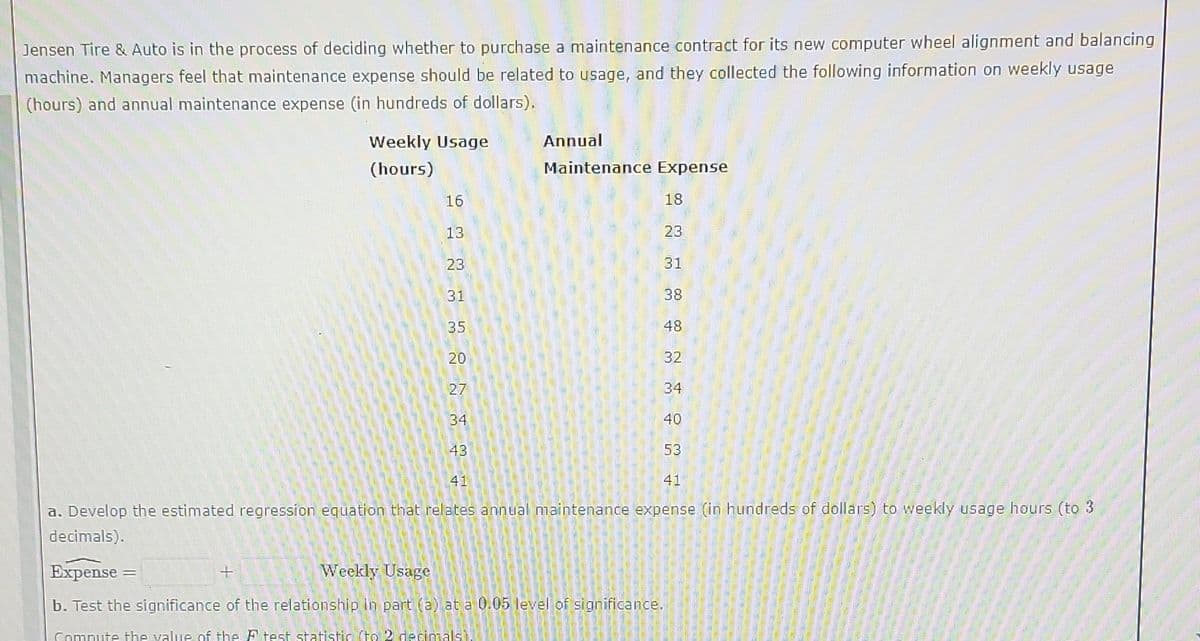
Transcribed Image Text:Jensen Tire & Auto is in the process of deciding whether to purchase a maintenance contract for its new computer wheel alignment and balancing
machine. Managers feel that maintenance expense should be related to usage, and they collected the following information on weekly usage
(hours) and annual maintenance expense (in hundreds of dollars).
Weekly Usage
Annual
(hours)
Maintenance Expense
16
18
13
23
23
31
31
38
35
48
20
32
27
34
34
40
43
53
41
41
a. Develop the estimated regression eguation that relates annual maintenance expense (in hundreds of dollars) to weekly usage hours (to 3
decimals).
Expense
Weekly Usage
b. Test the significance of the relationship in part (a) at a 0.05 level of significance.
Compute the value of the F test statistic to 2 decinals).
Expert Solution
This question has been solved!
Explore an expertly crafted, step-by-step solution for a thorough understanding of key concepts.

Step by step
Solved in 3 steps with 5 images

Recommended textbooks for you
Glencoe Algebra 1, Student Edition, 9780079039897…
Algebra
ISBN:
9780079039897
Author:
Carter
Publisher:
McGraw Hill

Big Ideas Math A Bridge To Success Algebra 1: Stu…
Algebra
ISBN:
9781680331141
Author:
HOUGHTON MIFFLIN HARCOURT
Publisher:
Houghton Mifflin Harcourt
Glencoe Algebra 1, Student Edition, 9780079039897…
Algebra
ISBN:
9780079039897
Author:
Carter
Publisher:
McGraw Hill
Big Ideas Math A Bridge To Success Algebra 1: Stu…
Algebra
ISBN:
9781680331141
Author:
HOUGHTON MIFFLIN HARCOURT
Publisher:
Houghton Mifflin Harcourt