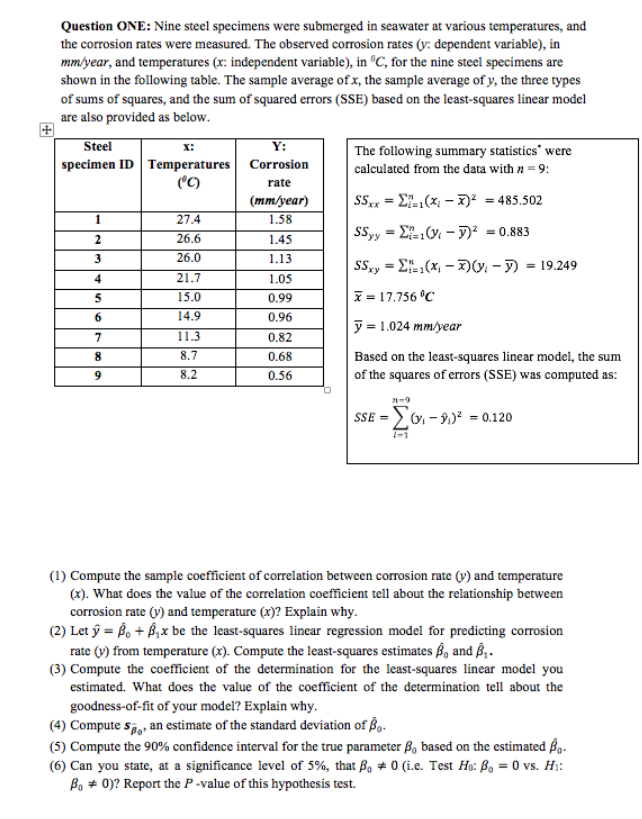
tes were measured. The observed corrosion rates (y: dependent mperatures (x: independent variable), in ºC, for the nine steel sp lowing table. The sample average of x, the sample average of y res, and the sum of squared errors (SSE) based on the least-squa d as below. Y: The following summary : calculated from the data w X: Temperatures Corrosion ('C) rate (ттуear) 1.58 27.4 26.6 1.45 26.0 1.13 SS,y = E-,(x, – 3)V 21.7 1.05 15.0 ī = 17.756 °C 0.99 14.9 0.96 y = 1.024 mm/year 11.3 0.82

Functions and Change: A Modeling Approach to College Algebra (MindTap Course List)
6th Edition
ISBN:9781337111348
Author:Bruce Crauder, Benny Evans, Alan Noell
Publisher:Bruce Crauder, Benny Evans, Alan Noell
Chapter5: A Survey Of Other Common Functions
Section5.3: Modeling Data With Power Functions
Problem 6E: Urban Travel Times Population of cities and driving times are related, as shown in the accompanying...
icon
Related questions
icon
Concept explainers
Topic Video
Question
Question ONE: Nine steel specimens were submerged in seawater at various temperatures, and
the corrosion rates were measured. The observed corrosion rates (y: dependent variable), in
mm/year, and temperatures (x: independent variable), in ºC, for the nine steel specimens are
shown in the following table. The sample average of x, the sample average of y, the three types
of sums of squares, and the sum of squared errors (SSE) based on the least-squares linear model
are also provided as below.
Steel
X:
Y:
The following summary statistics" were
specimen ID Temperatures Corrosion
("C)
calculated from the data with n = 9:
rate
(mm/year)
SsΣ. (x-3485.502
1
27.4
1.58
SSyy = E – )² = 0.883
%3D
2
26.6
1.45
3
26.0
1.13
SS.y = E(x, – 7)V. - 7)
= 19.249
4
21.7
1.05
5
15.0
0.99
I = 17.756 °C
6.
14.9
0.96
y = 1.024 mm/year
11.3
0.82
8.7
0.68
Based on the least-squares linear model, the sum
8
9
8.2
0.56
of the squares of errors (SSE) was computed as:
n-9
SSE = 0 - 9)² = 0.120
-1
(1) Compute the sample coefficient of correlation between corrosion rate (v) and temperature
(x). What does the value of the correlation coefficient tell about the relationship between
corrosion rate (v) and temperature (x)? Explain why.
(2) Let ŷ = Bo + B, x be the least-squares linear regression model for predicting corrosion
rate (y) from temperature (x). Compute the least-squares estimates ß, and ß,.
(3) Compute the coefficient of the determination for the least-squares linear model you
estimated. What does the value of the coefficient of the determination tell about the
goodness-of-fit of your model? Explain why.
(4) Compute sp,, an estimate of the standard deviation of ßg.
(5) Compute the 90% confidence interval for the true parameter B, based on the estimated Bg.
(6) Can you state, at a significance level of 5%, that B, # 0 (i.e. Test Ho: B, = 0 vs. H:
Bo # 0)? Report the P -value of this hypothesis test.
Transcribed Image Text:Question ONE: Nine steel specimens were submerged in seawater at various temperatures, and the corrosion rates were measured. The observed corrosion rates (y: dependent variable), in mm/year, and temperatures (x: independent variable), in ºC, for the nine steel specimens are shown in the following table. The sample average of x, the sample average of y, the three types of sums of squares, and the sum of squared errors (SSE) based on the least-squares linear model are also provided as below. Steel X: Y: The following summary statistics" were specimen ID Temperatures Corrosion ("C) calculated from the data with n = 9: rate (mm/year) SsΣ. (x-3485.502 1 27.4 1.58 SSyy = E – )² = 0.883 %3D 2 26.6 1.45 3 26.0 1.13 SS.y = E(x, – 7)V. - 7) = 19.249 4 21.7 1.05 5 15.0 0.99 I = 17.756 °C 6. 14.9 0.96 y = 1.024 mm/year 11.3 0.82 8.7 0.68 Based on the least-squares linear model, the sum 8 9 8.2 0.56 of the squares of errors (SSE) was computed as: n-9 SSE = 0 - 9)² = 0.120 -1 (1) Compute the sample coefficient of correlation between corrosion rate (v) and temperature (x). What does the value of the correlation coefficient tell about the relationship between corrosion rate (v) and temperature (x)? Explain why. (2) Let ŷ = Bo + B, x be the least-squares linear regression model for predicting corrosion rate (y) from temperature (x). Compute the least-squares estimates ß, and ß,. (3) Compute the coefficient of the determination for the least-squares linear model you estimated. What does the value of the coefficient of the determination tell about the goodness-of-fit of your model? Explain why. (4) Compute sp,, an estimate of the standard deviation of ßg. (5) Compute the 90% confidence interval for the true parameter B, based on the estimated Bg. (6) Can you state, at a significance level of 5%, that B, # 0 (i.e. Test Ho: B, = 0 vs. H: Bo # 0)? Report the P -value of this hypothesis test.
Expert Solution
steps

Step by step

Solved in 3 steps with 2 images

Blurred answer
Knowledge Booster
Centre, Spread, and Shape of a Distribution
Learn more about
Need a deep-dive on the concept behind this application? Look no further. Learn more about this topic, statistics and related others by exploring similar questions and additional content below.
Recommended textbooks for you
Functions and Change: A Modeling Approach to Coll…
Algebra
ISBN:
9781337111348
Author:
Bruce Crauder, Benny Evans, Alan Noell
Publisher:
Cengage Learning