The accompanying data represent the total travel tax (in dollars) for a 3-day business trip in 8 randomly selected cities. A normal probability plot suggests the data could come from a population that is normally distributed. A boxplot indicates there are no outliers. Complete parts (a) through (c) below. Question Help 68.35 79.51 70.93 83.43 79.62 85.02 Click the icon to view the table of critical t-values. 100.35 97.14 (a) Determine a point estimate for the population mean travel tax. A point estimate for the population mean travel tax is $ (Round to two decimal places as needed.) (b) Construct and interpret a 95% confidence interval for the mean tax paid for a three-day business trip. Select the correct choice below and fill in the answer boxes to complete your choice. (Round to two decimal places as needed.) O A. One can be % confident that the mean travel tax for all cities is between $ and $ B. There is a % probability that the mean travel tax for all cities is between $ and $ OC. The travel tax is between $ and $ % of all cities. for Click to select your answer(s). 7:48 PM N 19 OEt 11/10/2019 Type here to search BUS delete prt sc SYSTG insert pouse break 11 19 $7 X 16 15 f3 bo JE esc & 7 6 # 4 3 2 U Y T R E W fob K CO I The accompanying data represent the total travel tax (in dollars) for a 3-day business trip in 8 randomly selected cities. A normal probability plot suggests the data could come from a population that is normally distributed. A boxplot indicates there are no outliers. Complete parts (a) through (c) below. 8.35 79.51 70.93 83.43 79.62 85.02 Click the icon to view the table of critical t-values. 100.35 97.14 B. There is a % probability that the mean travel tax for all cities is between $ and $ OC. The travel tax is between $ and $ for % of all cities. D. One can be % confident that the all cities have a travel tax between $ and $ (c) What would you recommend to a researcher who wants to increase the precision of the interval, but does not have access to additional data? O A. The researcher could decrease the level of confidence. B. The researcher could increase the level of confidence C. The researcher could decrease the sample standard deviation D. The researcher could increase the sample mean. Click to select your answer(s). 7:48 PM O Et N 19 11/10/2019 Type here to search SUS prt sc ins pause break ho bisAs f9 17 15 JE % 5 esc 7 # 3 4 2 7 U Y T R E W K H CO
The accompanying data represent the total travel tax (in dollars) for a 3-day business trip in 8 randomly selected cities. A normal probability plot suggests the data could come from a population that is normally distributed. A boxplot indicates there are no outliers. Complete parts (a) through (c) below. Question Help 68.35 79.51 70.93 83.43 79.62 85.02 Click the icon to view the table of critical t-values. 100.35 97.14 (a) Determine a point estimate for the population mean travel tax. A point estimate for the population mean travel tax is $ (Round to two decimal places as needed.) (b) Construct and interpret a 95% confidence interval for the mean tax paid for a three-day business trip. Select the correct choice below and fill in the answer boxes to complete your choice. (Round to two decimal places as needed.) O A. One can be % confident that the mean travel tax for all cities is between $ and $ B. There is a % probability that the mean travel tax for all cities is between $ and $ OC. The travel tax is between $ and $ % of all cities. for Click to select your answer(s). 7:48 PM N 19 OEt 11/10/2019 Type here to search BUS delete prt sc SYSTG insert pouse break 11 19 $7 X 16 15 f3 bo JE esc & 7 6 # 4 3 2 U Y T R E W fob K CO I The accompanying data represent the total travel tax (in dollars) for a 3-day business trip in 8 randomly selected cities. A normal probability plot suggests the data could come from a population that is normally distributed. A boxplot indicates there are no outliers. Complete parts (a) through (c) below. 8.35 79.51 70.93 83.43 79.62 85.02 Click the icon to view the table of critical t-values. 100.35 97.14 B. There is a % probability that the mean travel tax for all cities is between $ and $ OC. The travel tax is between $ and $ for % of all cities. D. One can be % confident that the all cities have a travel tax between $ and $ (c) What would you recommend to a researcher who wants to increase the precision of the interval, but does not have access to additional data? O A. The researcher could decrease the level of confidence. B. The researcher could increase the level of confidence C. The researcher could decrease the sample standard deviation D. The researcher could increase the sample mean. Click to select your answer(s). 7:48 PM O Et N 19 11/10/2019 Type here to search SUS prt sc ins pause break ho bisAs f9 17 15 JE % 5 esc 7 # 3 4 2 7 U Y T R E W K H CO

Glencoe Algebra 1, Student Edition, 9780079039897, 0079039898, 2018
18th Edition
ISBN:9780079039897
Author:Carter
Publisher:Carter
Chapter10: Statistics
Section10.1: Measures Of Center
Problem 13PPS

Related questions
Question
100%
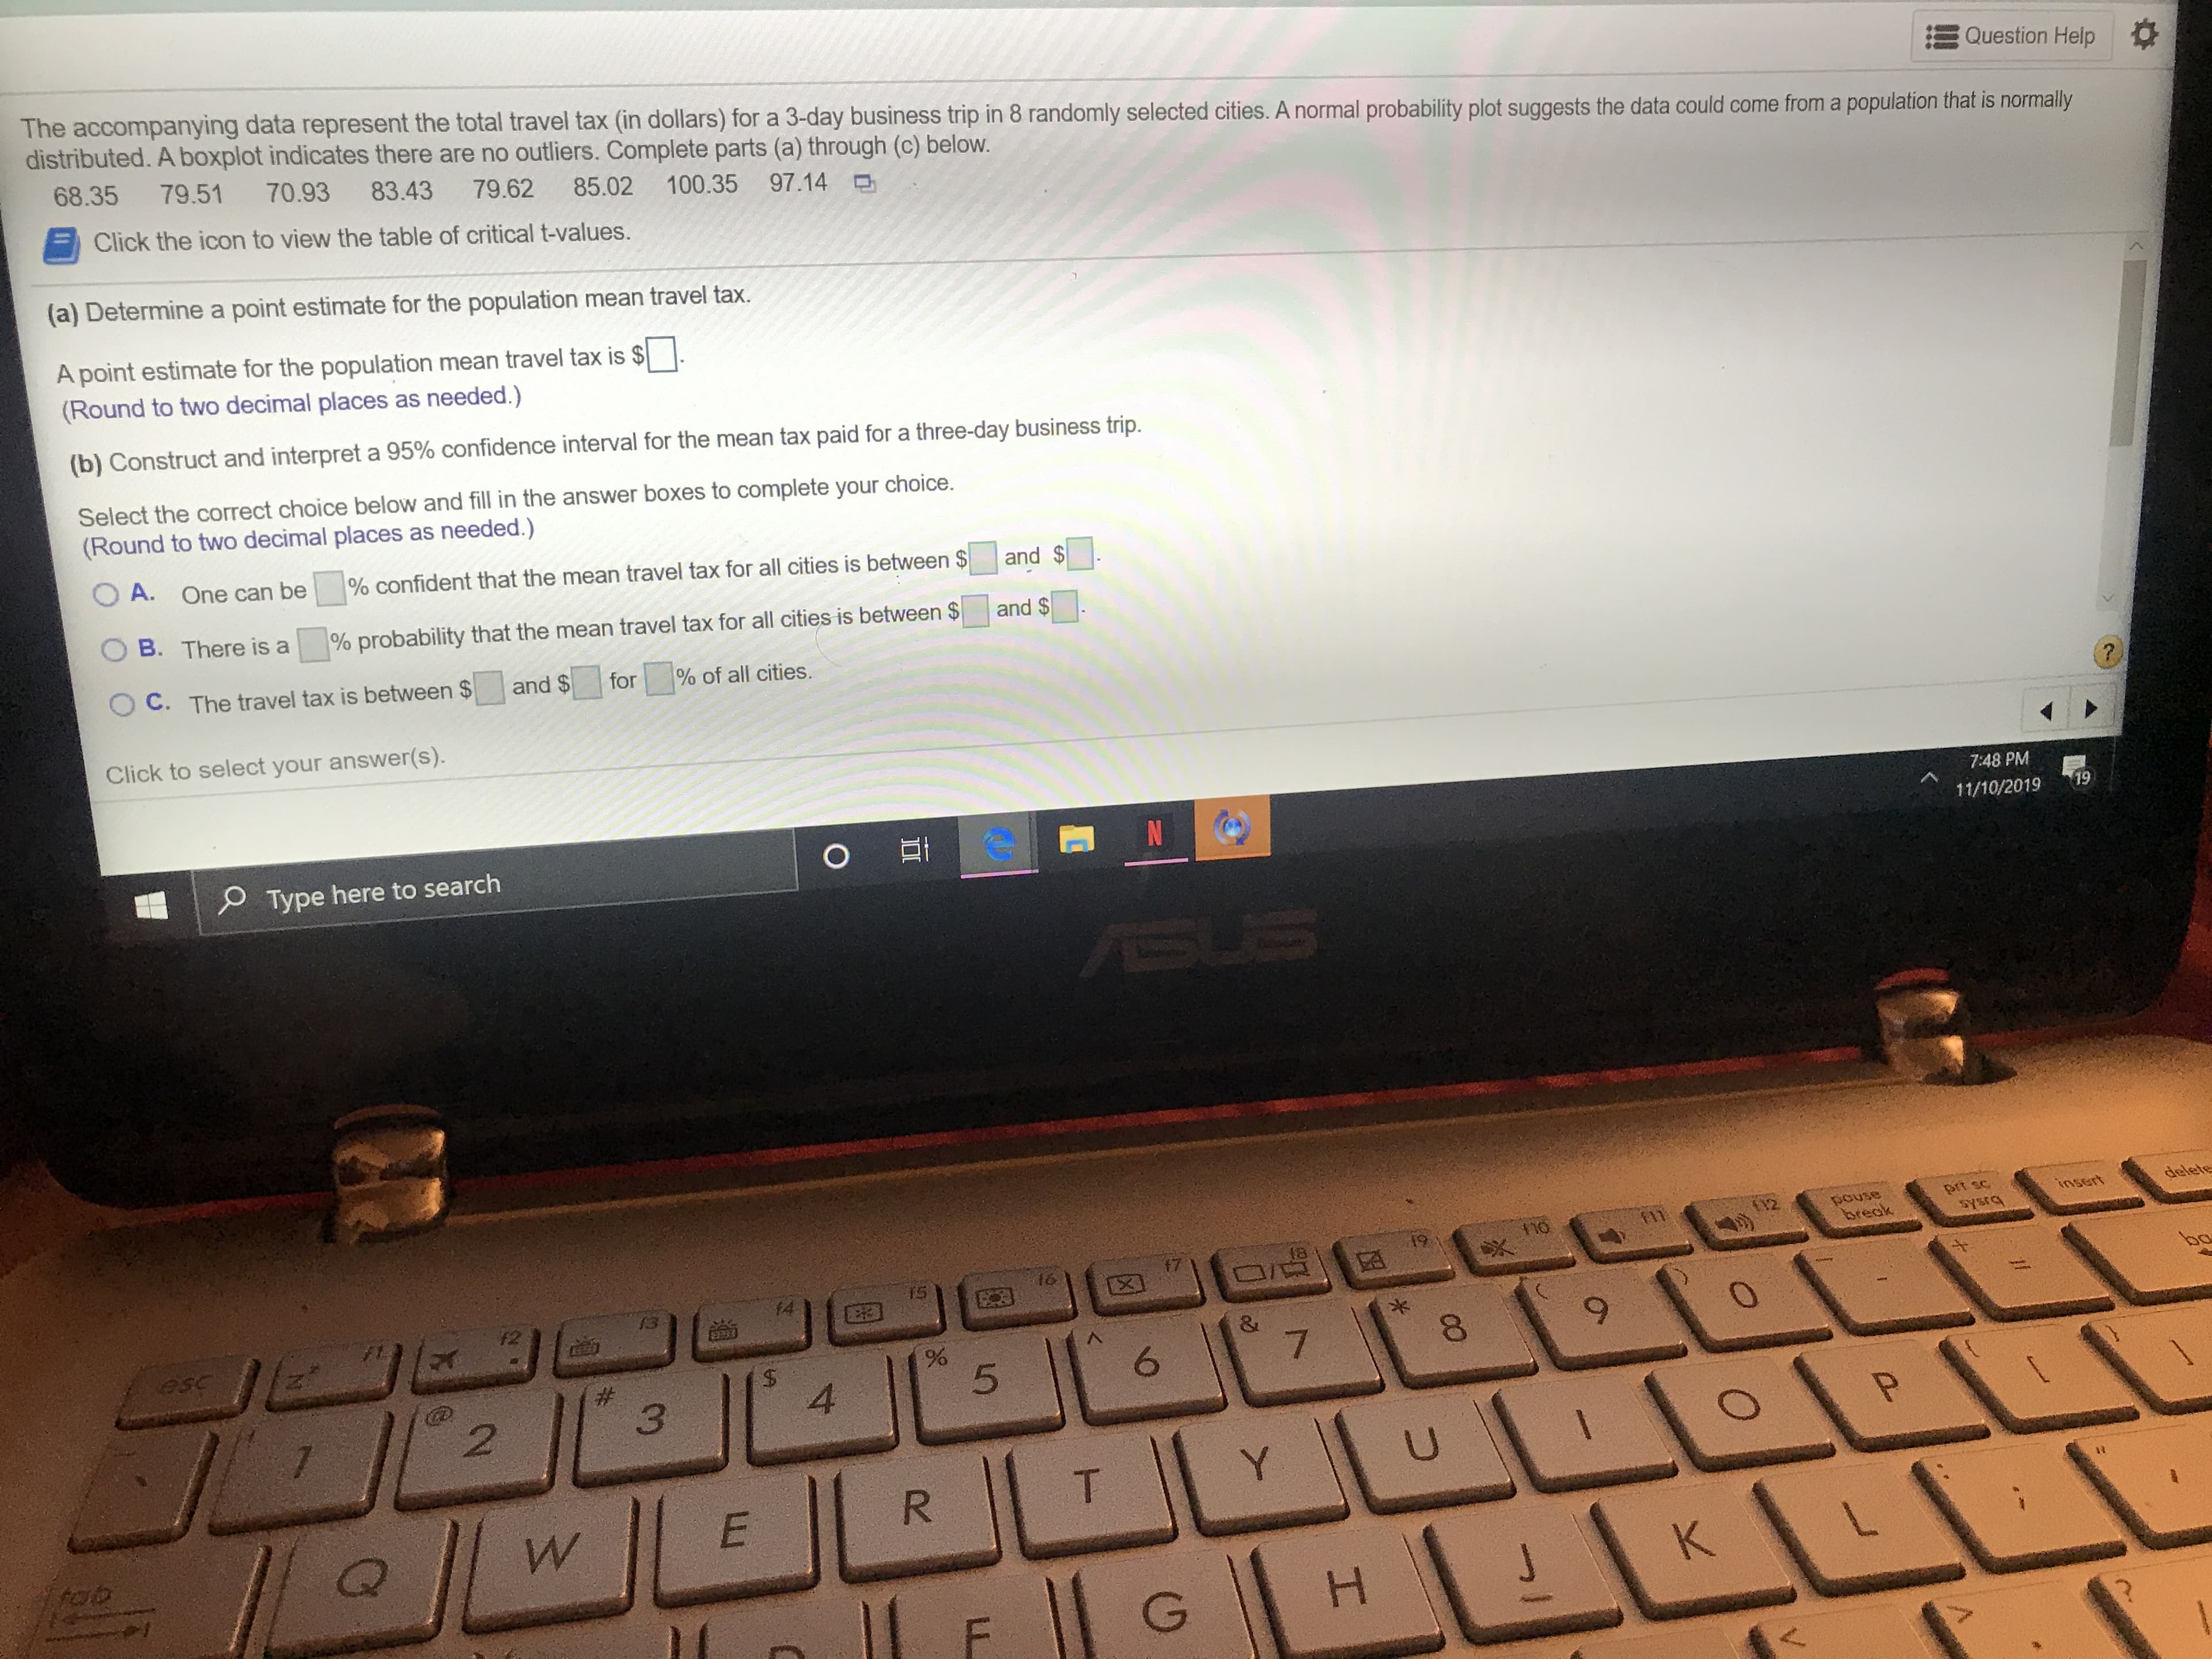
Transcribed Image Text:The accompanying data represent the total travel tax (in dollars) for a 3-day business trip in 8 randomly selected cities. A normal probability plot suggests the data could come from a population that is normally
distributed. A boxplot indicates there are no outliers. Complete parts (a) through (c) below.
Question Help
68.35
79.51
70.93
83.43
79.62
85.02
Click the icon to view the table of critical t-values.
100.35
97.14
(a) Determine a point estimate for the population mean travel tax.
A point estimate for the population mean travel tax is $
(Round to two decimal places as needed.)
(b) Construct and interpret a 95% confidence interval for the mean tax paid for a three-day business trip.
Select the correct choice below and fill in the answer boxes to complete your choice.
(Round to two decimal places as needed.)
O A.
One can be
% confident that the mean travel tax for all cities is between $
and $
B. There is a
% probability that the mean travel tax for all cities is between $
and $
OC. The travel tax is between $
and $
% of all cities.
for
Click to select your answer(s).
7:48 PM
N
19
OEt
11/10/2019
Type here to search
BUS
delete
prt sc
SYSTG
insert
pouse
break
11
19
$7
X
16
15
f3
bo
JE
esc
&
7
6
#
4
3
2
U
Y
T
R
E
W
fob
K
CO
I
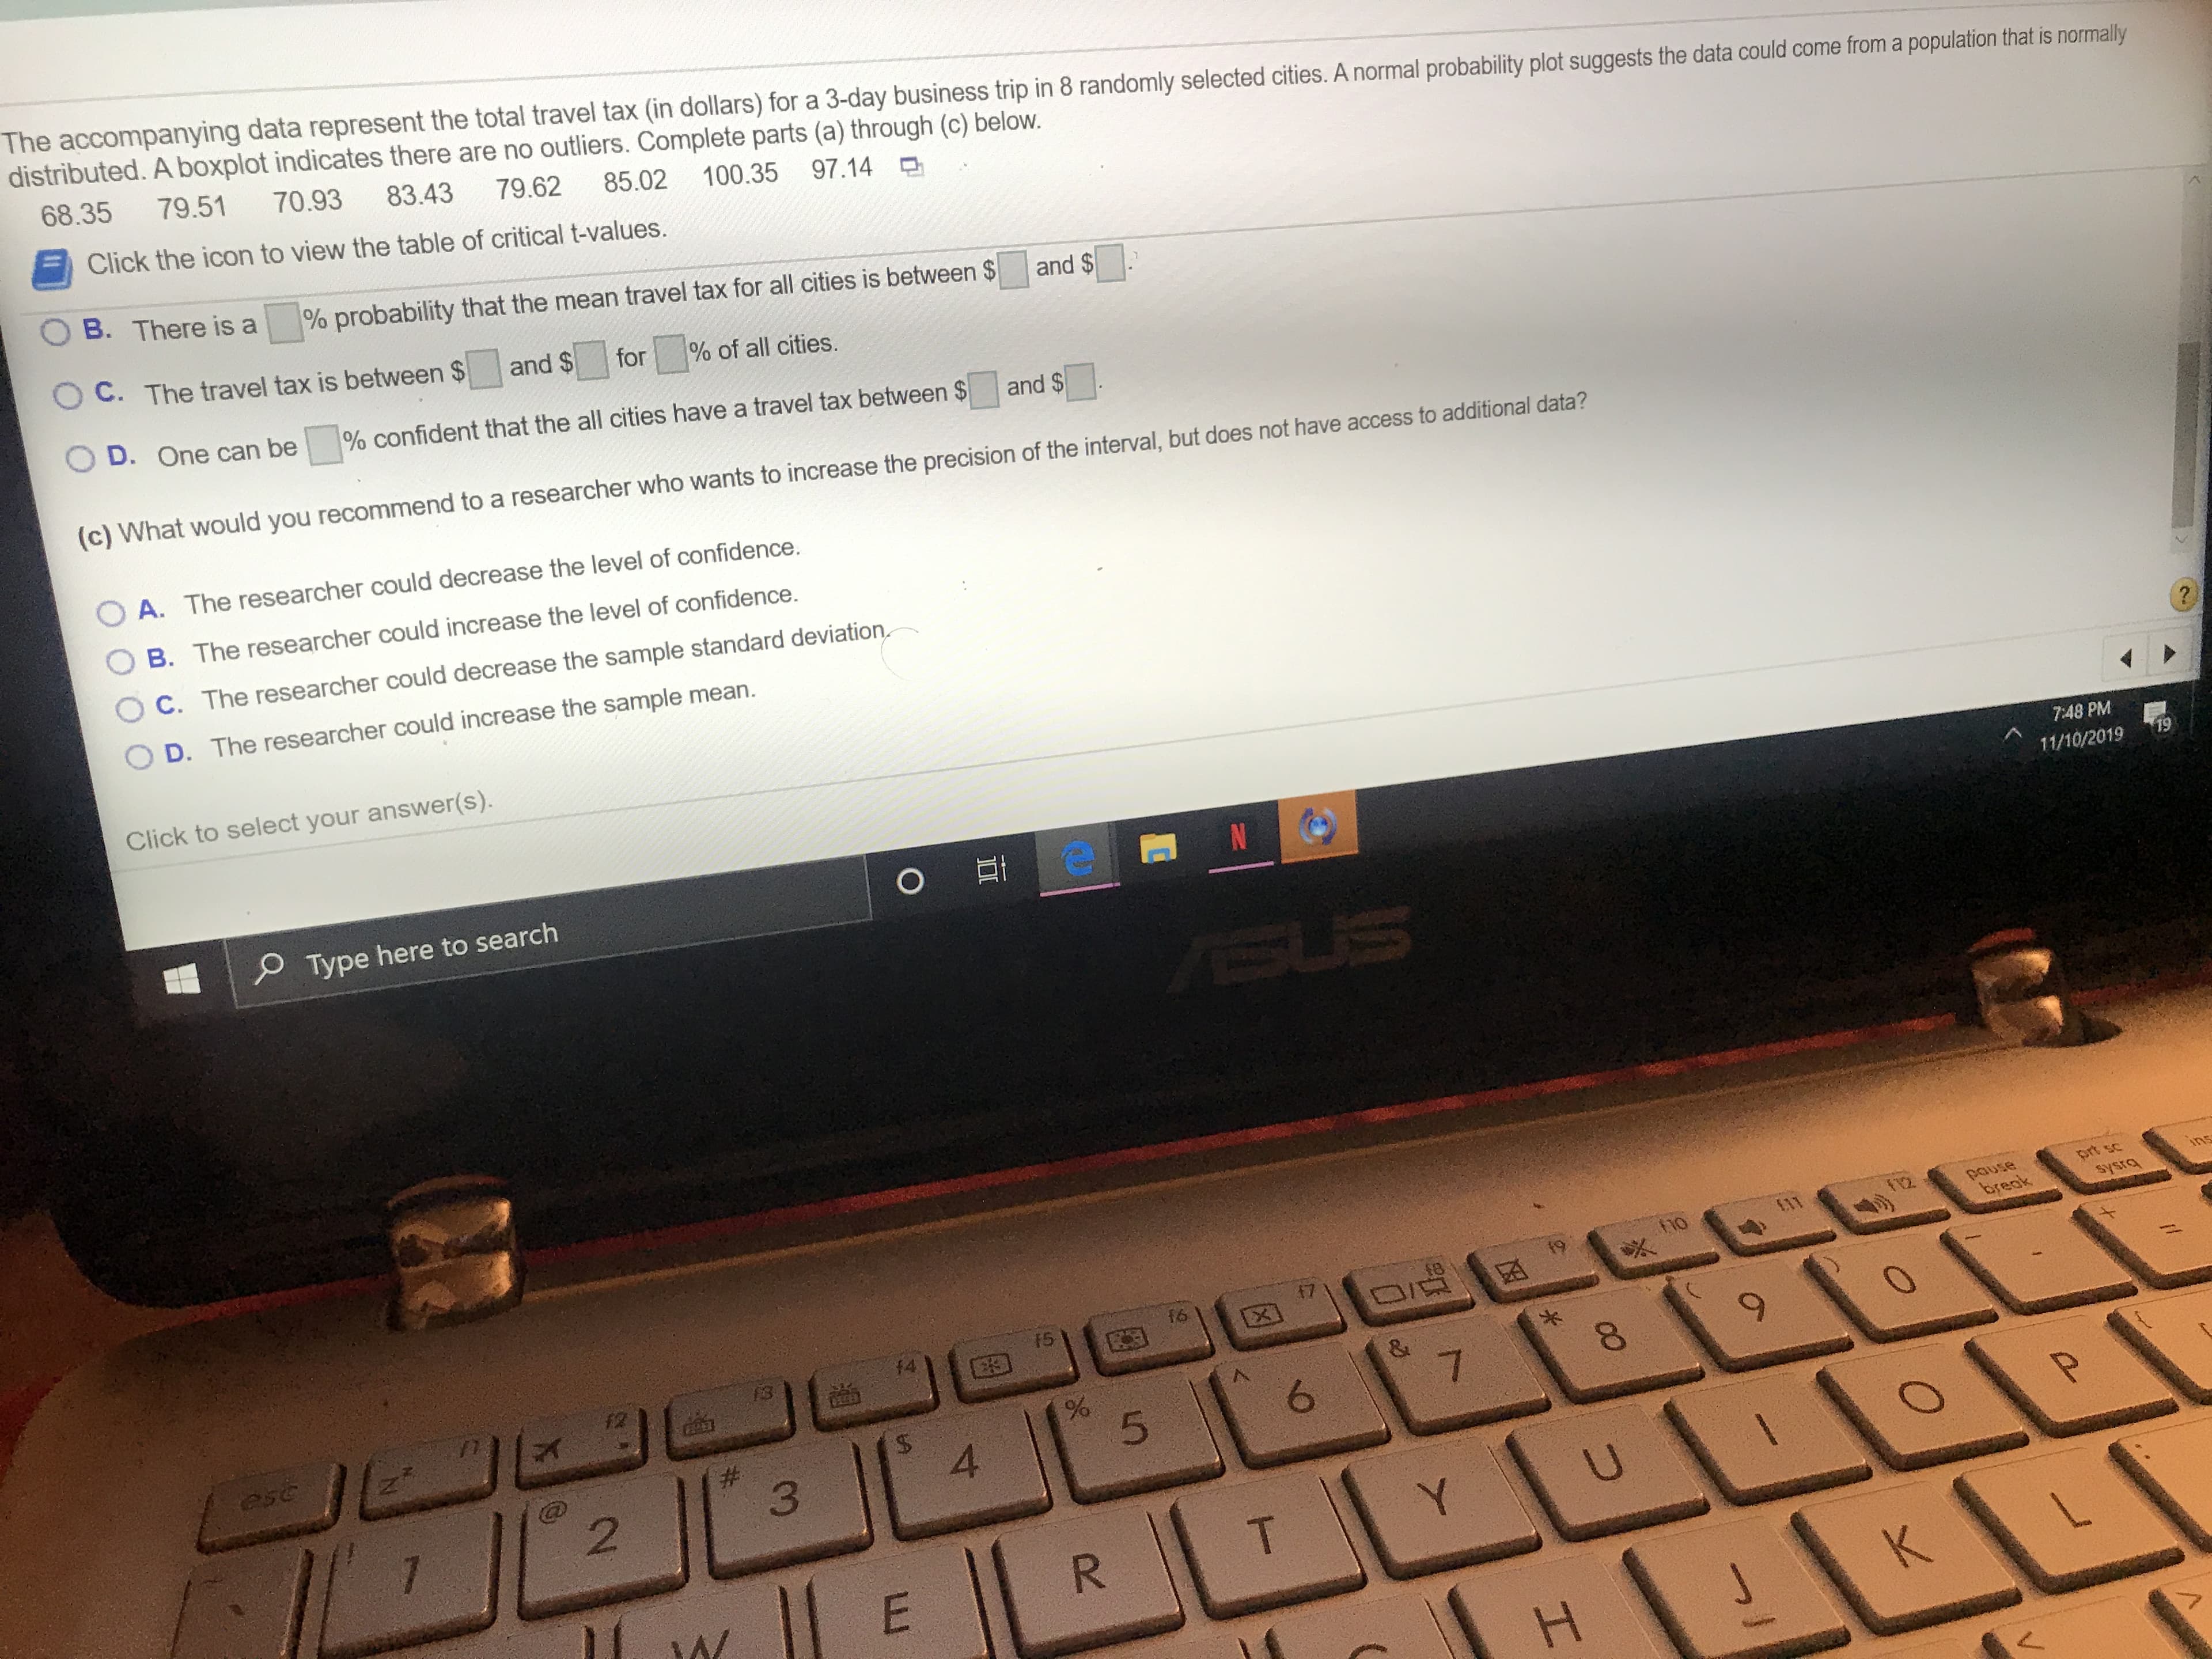
Transcribed Image Text:The accompanying data represent the total travel tax (in dollars) for a 3-day business trip in 8 randomly selected cities. A normal probability plot suggests the data could come from a population that is normally
distributed. A boxplot indicates there are no outliers. Complete parts (a) through (c) below.
8.35
79.51
70.93
83.43
79.62
85.02
Click the icon to view the table of critical t-values.
100.35
97.14
B. There is a
% probability that the mean travel tax for all cities is between $
and $
OC. The travel tax is between $
and $
for
% of all cities.
D. One can be
% confident that the all cities have a travel tax between $
and $
(c) What would you recommend to a researcher who wants to increase the precision of the interval, but does not have access to additional data?
O A. The researcher could decrease the level of confidence.
B. The researcher could increase the level of confidence
C. The researcher could decrease the sample standard deviation
D. The researcher could increase the sample mean.
Click to select your answer(s).
7:48 PM
O Et
N
19
11/10/2019
Type here to search
SUS
prt sc
ins
pause
break
ho
bisAs
f9
17
15
JE
%
5
esc
7
#
3
4
2
7
U
Y
T
R
E
W
K
H
CO
Expert Solution
This question has been solved!
Explore an expertly crafted, step-by-step solution for a thorough understanding of key concepts.

This is a popular solution!

Trending now
This is a popular solution!

Step by step
Solved in 3 steps with 1 images

Recommended textbooks for you
Glencoe Algebra 1, Student Edition, 9780079039897…
Algebra
ISBN:
9780079039897
Author:
Carter
Publisher:
McGraw Hill

Holt Mcdougal Larson Pre-algebra: Student Edition…
Algebra
ISBN:
9780547587776
Author:
HOLT MCDOUGAL
Publisher:
HOLT MCDOUGAL

Glencoe Algebra 1, Student Edition, 9780079039897…
Algebra
ISBN:
9780079039897
Author:
Carter
Publisher:
McGraw Hill
Holt Mcdougal Larson Pre-algebra: Student Edition…
Algebra
ISBN:
9780547587776
Author:
HOLT MCDOUGAL
Publisher:
HOLT MCDOUGAL