The accompanying data represent the weights (in grams) of a simple random sample of 10 M&M plain candies. Determine the shape of the distribution of weights of M&Ms by drawing a frequency histogram. Find the mean and median. Which measure of central tendency better describes the weight of a plain M&M? Click the icon to view the candy weight data. ..... Draw a frequency histogram. Choose the correct graph below. Weight of Plain M and Ms Weight of Plain M and Ms OA. В. 0.78 0.84 0.9 0.96 E 0.78 0.84 0.9 0.96 Weight (grams) Weight (grams) Weight of Plain M and Ms Weight of Plain M and Ms Oc. OD. 0.96 C 0.78 0.96 0.84 Weight (grams) 0.78 0.84 0.9 0.9 Weight (grams) Candy Weights Click to select your answer and then click Che 0.79 0.83 0.84 0.85 0.86 Tutoring Help Me Solve This Check Answer 0.86 0.88 0.90 0.88 0.93 Frequency Kouenbej Frequency Frequency
The accompanying data represent the weights (in grams) of a simple random sample of 10 M&M plain candies. Determine the shape of the distribution of weights of M&Ms by drawing a frequency histogram. Find the mean and median. Which measure of central tendency better describes the weight of a plain M&M? Click the icon to view the candy weight data. ..... Draw a frequency histogram. Choose the correct graph below. Weight of Plain M and Ms Weight of Plain M and Ms OA. В. 0.78 0.84 0.9 0.96 E 0.78 0.84 0.9 0.96 Weight (grams) Weight (grams) Weight of Plain M and Ms Weight of Plain M and Ms Oc. OD. 0.96 C 0.78 0.96 0.84 Weight (grams) 0.78 0.84 0.9 0.9 Weight (grams) Candy Weights Click to select your answer and then click Che 0.79 0.83 0.84 0.85 0.86 Tutoring Help Me Solve This Check Answer 0.86 0.88 0.90 0.88 0.93 Frequency Kouenbej Frequency Frequency

Glencoe Algebra 1, Student Edition, 9780079039897, 0079039898, 2018
18th Edition
ISBN:9780079039897
Author:Carter
Publisher:Carter
Chapter10: Statistics
Section10.4: Distributions Of Data
Problem 19PFA

Related questions

Topic Video
Question
Have fun
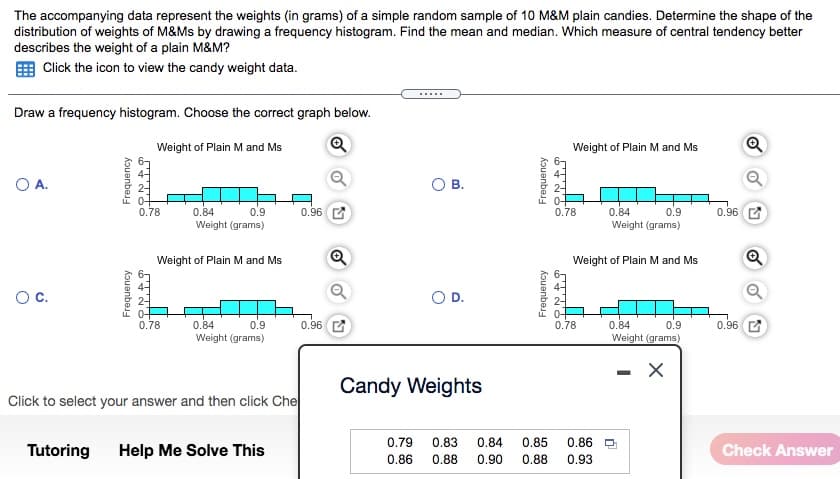
Transcribed Image Text:The accompanying data represent the weights (in grams) of a simple random sample of 10 M&M plain candies. Determine the shape of the
distribution of weights of M&Ms by drawing a frequency histogram. Find the mean and median. Which measure of central tendency better
describes the weight of a plain M&M?
Click the icon to view the candy weight data.
.....
Draw a frequency histogram. Choose the correct graph below.
Weight of Plain M and Ms
Weight of Plain M and Ms
OA.
В.
0.78
0.96
0.96
0.84
Weight (grams)
0.9
0.78
0.84
0.9
Weight (grams)
Weight of Plain M and Ms
Weight of Plain M and Ms
Oc.
OD.
0.96 C
0.78
0.96
0.84
Weight (grams)
0.78
0.84
0.9
0.9
Weight (grams)
Candy Weights
Click to select your answer and then click Che
0.79
0.83
0.84
0.85
0.86
Tutoring
Help Me Solve This
Check Answer
0.86
0.88
0.90
0.88
0.93
Kouanbej
Kouanbej
Frequency
Frequency
Expert Solution
This question has been solved!
Explore an expertly crafted, step-by-step solution for a thorough understanding of key concepts.

This is a popular solution!

Trending now
This is a popular solution!

Step by step
Solved in 2 steps

Knowledge Booster


Learn more about
Need a deep-dive on the concept behind this application? Look no further. Learn more about this topic, statistics and related others by exploring similar questions and additional content below.Recommended textbooks for you
Glencoe Algebra 1, Student Edition, 9780079039897…
Algebra
ISBN:
9780079039897
Author:
Carter
Publisher:
McGraw Hill
Glencoe Algebra 1, Student Edition, 9780079039897…
Algebra
ISBN:
9780079039897
Author:
Carter
Publisher:
McGraw Hill