The accompanying figure shows the demand curve, marginal revenue curve, marginal cost eurve and average total cost curve for a monopolist. 30 28 26 24 22 20 18- 16 ATC 12 10 -MC 4 MR 2 3 6 9 10 Quantity (units/day! 1) This monopolist maximizes its profit by producing charging a price of 4 units per day and 18 per unit 2) The socially optimal level of output is 8 units per day. 3) At this monopolist s profit-maximizing level of output what is its economic profit or loss? The economie loss is $-72 at the profit maximizing level. 4) At his monopolist's socially optimal level of output, what is its economic profit or loss? The Economic loss is $-64 at the socially optimal level. 5) At this monopolist's profit-maximizing level of output what the deadweight loss to society! 14 of 118 words Focus 31 பொ/து *uu
The accompanying figure shows the demand curve, marginal revenue curve, marginal cost eurve and average total cost curve for a monopolist. 30 28 26 24 22 20 18- 16 ATC 12 10 -MC 4 MR 2 3 6 9 10 Quantity (units/day! 1) This monopolist maximizes its profit by producing charging a price of 4 units per day and 18 per unit 2) The socially optimal level of output is 8 units per day. 3) At this monopolist s profit-maximizing level of output what is its economic profit or loss? The economie loss is $-72 at the profit maximizing level. 4) At his monopolist's socially optimal level of output, what is its economic profit or loss? The Economic loss is $-64 at the socially optimal level. 5) At this monopolist's profit-maximizing level of output what the deadweight loss to society! 14 of 118 words Focus 31 பொ/து *uu

Managerial Economics: Applications, Strategies and Tactics (MindTap Course List)
14th Edition
ISBN:9781305506381
Author:James R. McGuigan, R. Charles Moyer, Frederick H.deB. Harris
Publisher:James R. McGuigan, R. Charles Moyer, Frederick H.deB. Harris
Chapter16: Government Regulation
Section: Chapter Questions
Problem 10E

Related questions
Question
5. At this monopolist’s profit-maximizing level of output what the
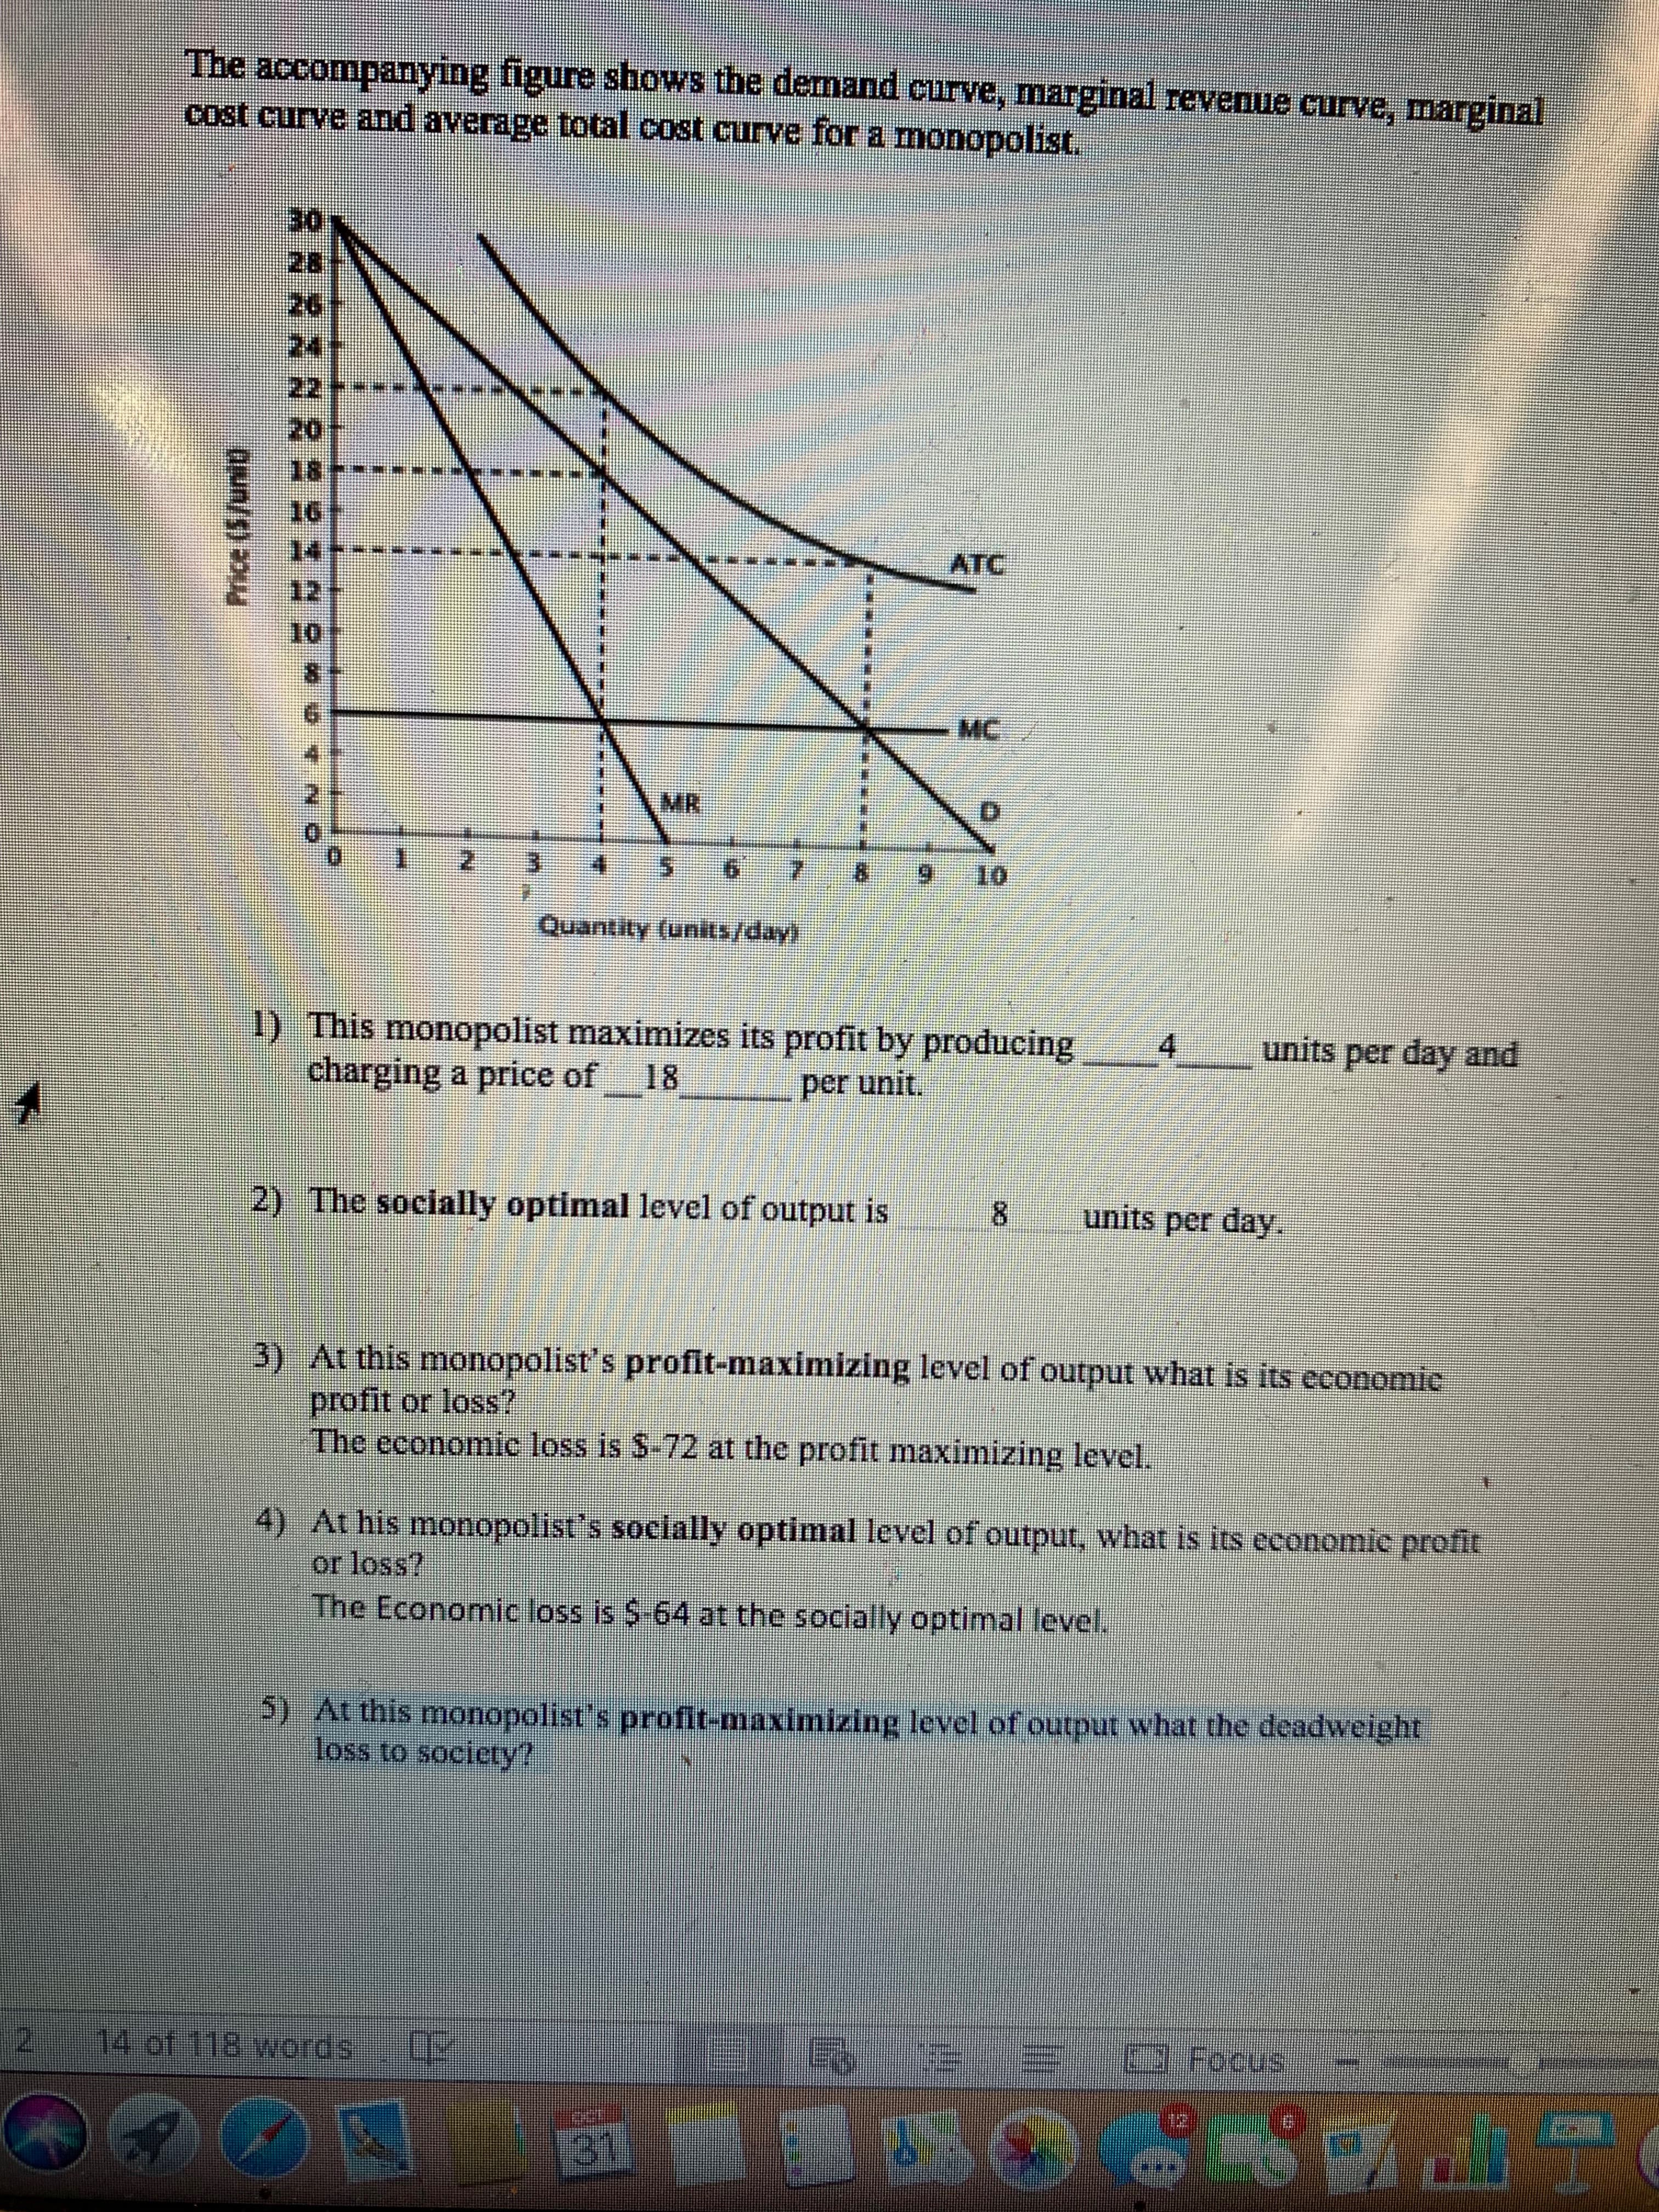
Transcribed Image Text:The accompanying figure shows the demand curve, marginal revenue curve, marginal
cost eurve and average total cost curve for a monopolist.
30
28
26
24
22
20
18-
16
ATC
12
10
-MC
4
MR
2
3
6
9
10
Quantity (units/day!
1) This monopolist maximizes its profit by producing
charging a price of
4
units per day and
18
per unit
2) The socially optimal level of output is
8
units per day.
3) At this monopolist s profit-maximizing level of output what is its economic
profit or loss?
The economie loss is $-72 at the profit maximizing level.
4) At his monopolist's socially optimal level of output, what is its economic profit
or loss?
The Economic loss is $-64 at the socially optimal level.
5) At this monopolist's profit-maximizing level of output what the deadweight
loss to society!
14 of 118 words
Focus
31
பொ/து *uu
Expert Solution
This question has been solved!
Explore an expertly crafted, step-by-step solution for a thorough understanding of key concepts.

This is a popular solution!

Trending now
This is a popular solution!

Step by step
Solved in 4 steps with 2 images

Knowledge Booster


Learn more about
Need a deep-dive on the concept behind this application? Look no further. Learn more about this topic, economics and related others by exploring similar questions and additional content below.Recommended textbooks for you
Managerial Economics: Applications, Strategies an…
Economics
ISBN:
9781305506381
Author:
James R. McGuigan, R. Charles Moyer, Frederick H.deB. Harris
Publisher:
Cengage Learning

Microeconomics: Principles & Policy
Economics
ISBN:
9781337794992
Author:
William J. Baumol, Alan S. Blinder, John L. Solow
Publisher:
Cengage Learning

Managerial Economics: Applications, Strategies an…
Economics
ISBN:
9781305506381
Author:
James R. McGuigan, R. Charles Moyer, Frederick H.deB. Harris
Publisher:
Cengage Learning
Microeconomics: Principles & Policy
Economics
ISBN:
9781337794992
Author:
William J. Baumol, Alan S. Blinder, John L. Solow
Publisher:
Cengage Learning
