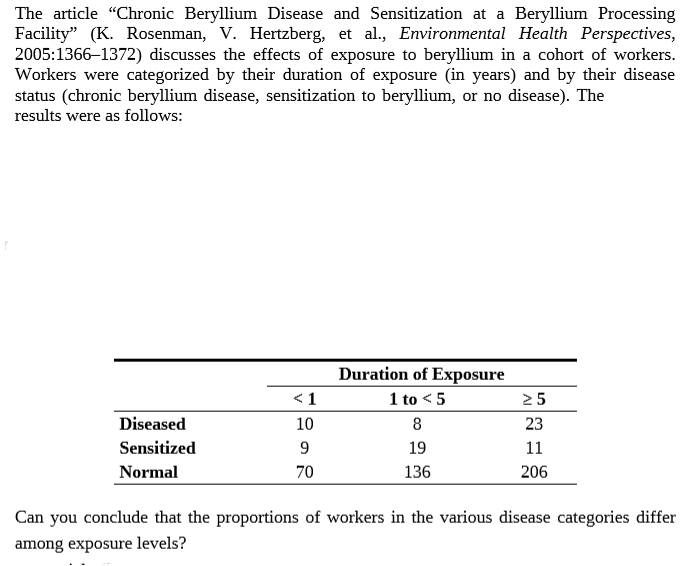
The article "Chronic Beryllium Disease and Sensitization at a Beryllium Processing Facility" (K. Rosenman, V. Hertzberg, et al., Environmental Health Perspectives, 2005:1366–1372) discusses the effects of exposure to beryllium in a cohort of workers. Workers were categorized by their duration of exposure (in years) and by their disease status (chronic beryllium disease, sensitization to beryllium, or no disease). The results were as follows: Duration of Exposure 1 to < 5 <1 25 Diseased 10 23 Sensitized 19 11 Normal 70 136 206 Can you conclude that the proportions of workers in the various disease categories differ among exposure levels?
The article "Chronic Beryllium Disease and Sensitization at a Beryllium Processing Facility" (K. Rosenman, V. Hertzberg, et al., Environmental Health Perspectives, 2005:1366–1372) discusses the effects of exposure to beryllium in a cohort of workers. Workers were categorized by their duration of exposure (in years) and by their disease status (chronic beryllium disease, sensitization to beryllium, or no disease). The results were as follows: Duration of Exposure 1 to < 5 <1 25 Diseased 10 23 Sensitized 19 11 Normal 70 136 206 Can you conclude that the proportions of workers in the various disease categories differ among exposure levels?

MATLAB: An Introduction with Applications
6th Edition
ISBN:9781119256830
Author:Amos Gilat
Publisher:Amos Gilat
Chapter1: Starting With Matlab
Section: Chapter Questions
Problem 1P

Related questions
Question
Transcribed Image Text:The article "Chronic Beryllium Disease and Sensitization at a Beryllium Processing
Facility" (K. Rosenman, V. Hertzberg, et al., Environmental Health Perspectives,
2005:1366–1372) discusses the effects of exposure to beryllium in a cohort of workers.
Workers were categorized by their duration of exposure (in years) and by their disease
status (chronic beryllium disease, sensitization to beryllium, or no disease). The
results were as follows:
Duration of Exposure
1 to < 5
<1
25
Diseased
10
23
Sensitized
19
11
Normal
70
136
206
Can you conclude that the proportions of workers in the various disease categories differ
among exposure levels?
Expert Solution
This question has been solved!
Explore an expertly crafted, step-by-step solution for a thorough understanding of key concepts.

This is a popular solution!

Trending now
This is a popular solution!

Step by step
Solved in 3 steps with 3 images

Recommended textbooks for you
MATLAB: An Introduction with Applications
Statistics
ISBN:
9781119256830
Author:
Amos Gilat
Publisher:
John Wiley & Sons Inc

Probability and Statistics for Engineering and th…
Statistics
ISBN:
9781305251809
Author:
Jay L. Devore
Publisher:
Cengage Learning

Statistics for The Behavioral Sciences (MindTap C…
Statistics
ISBN:
9781305504912
Author:
Frederick J Gravetter, Larry B. Wallnau
Publisher:
Cengage Learning
MATLAB: An Introduction with Applications
Statistics
ISBN:
9781119256830
Author:
Amos Gilat
Publisher:
John Wiley & Sons Inc
Probability and Statistics for Engineering and th…
Statistics
ISBN:
9781305251809
Author:
Jay L. Devore
Publisher:
Cengage Learning
Statistics for The Behavioral Sciences (MindTap C…
Statistics
ISBN:
9781305504912
Author:
Frederick J Gravetter, Larry B. Wallnau
Publisher:
Cengage Learning

Elementary Statistics: Picturing the World (7th E…
Statistics
ISBN:
9780134683416
Author:
Ron Larson, Betsy Farber
Publisher:
PEARSON

The Basic Practice of Statistics
Statistics
ISBN:
9781319042578
Author:
David S. Moore, William I. Notz, Michael A. Fligner
Publisher:
W. H. Freeman

Introduction to the Practice of Statistics
Statistics
ISBN:
9781319013387
Author:
David S. Moore, George P. McCabe, Bruce A. Craig
Publisher:
W. H. Freeman