The article "Flexure of Concrete Beams Reinforced with Advanced Composite Orthogrids" (J. of Aerospace Engr, 1997: 7-15) gave the accompanying data on ultimate load (kN) for two different types of beams. Sample Sample Sample Mean Туре SD Size 33.4 2.2 Fiberglass grid 26 26 42.8 4.3 Commercial carbon grid a. Assuming that the underlying distributions are normal calculate and interpret a 99% CI for the difference between true average load for the fiberglass beams and that for the carbon beams. b. Does the upper limit of the interval you calculated in part (a) give a 99% upper confidence bound for the difference between the two us? If not, calculate such a bound. Does it strongly suggest that true average load for the carbon beams is more than that for the fiberglass beams? Explain
The article "Flexure of Concrete Beams Reinforced with Advanced Composite Orthogrids" (J. of Aerospace Engr, 1997: 7-15) gave the accompanying data on ultimate load (kN) for two different types of beams. Sample Sample Sample Mean Туре SD Size 33.4 2.2 Fiberglass grid 26 26 42.8 4.3 Commercial carbon grid a. Assuming that the underlying distributions are normal calculate and interpret a 99% CI for the difference between true average load for the fiberglass beams and that for the carbon beams. b. Does the upper limit of the interval you calculated in part (a) give a 99% upper confidence bound for the difference between the two us? If not, calculate such a bound. Does it strongly suggest that true average load for the carbon beams is more than that for the fiberglass beams? Explain

MATLAB: An Introduction with Applications
6th Edition
ISBN:9781119256830
Author:Amos Gilat
Publisher:Amos Gilat
Chapter1: Starting With Matlab
Section: Chapter Questions
Problem 1P

Related questions
Question
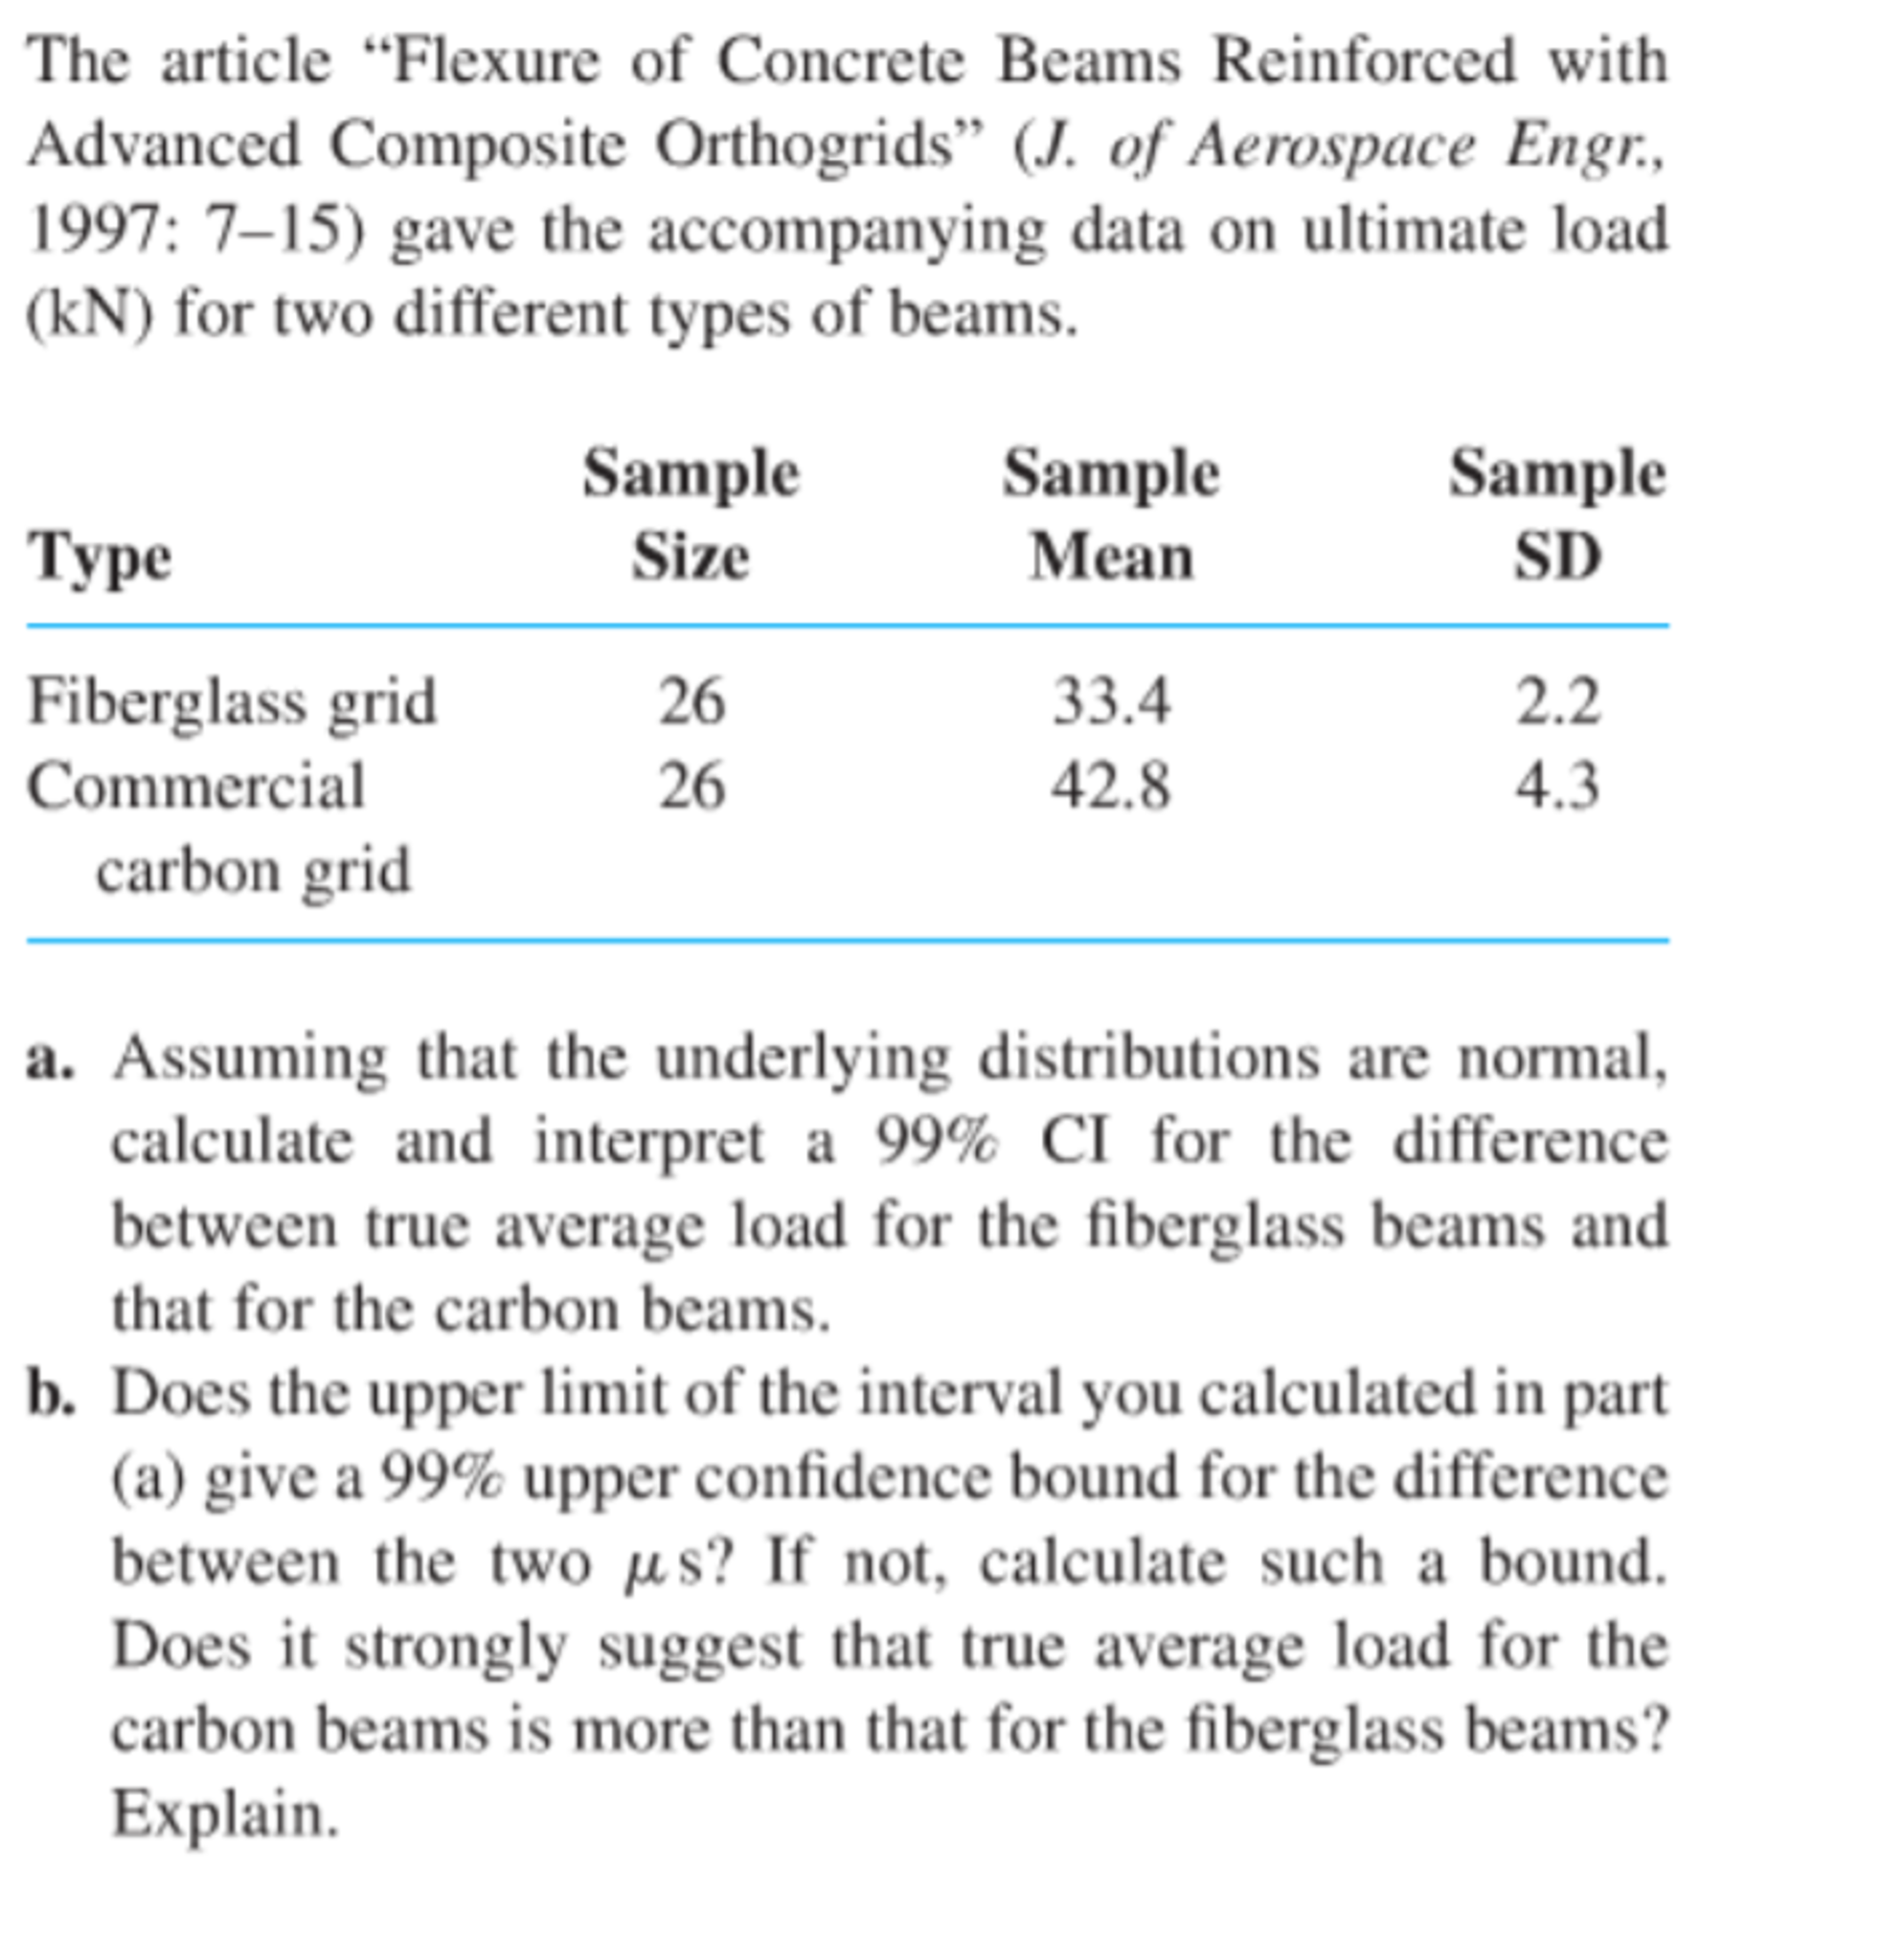
Transcribed Image Text:The article "Flexure of Concrete Beams Reinforced with
Advanced Composite Orthogrids" (J. of Aerospace Engr,
1997: 7-15) gave the accompanying data on ultimate load
(kN) for two different types of beams.
Sample
Sample
Sample
Mean
Туре
SD
Size
33.4
2.2
Fiberglass grid
26
26
42.8
4.3
Commercial
carbon grid
a. Assuming that the underlying distributions are normal
calculate and interpret a 99% CI for the difference
between true average load for the fiberglass beams and
that for the carbon beams.
b. Does the upper limit of the interval you calculated in part
(a) give a 99% upper confidence bound for the difference
between the two us? If not, calculate such a bound.
Does it strongly suggest that true average load for the
carbon beams is more than that for the fiberglass beams?
Explain
Expert Solution
This question has been solved!
Explore an expertly crafted, step-by-step solution for a thorough understanding of key concepts.

This is a popular solution!

Trending now
This is a popular solution!

Step by step
Solved in 3 steps with 1 images

Recommended textbooks for you
MATLAB: An Introduction with Applications
Statistics
ISBN:
9781119256830
Author:
Amos Gilat
Publisher:
John Wiley & Sons Inc

Probability and Statistics for Engineering and th…
Statistics
ISBN:
9781305251809
Author:
Jay L. Devore
Publisher:
Cengage Learning

Statistics for The Behavioral Sciences (MindTap C…
Statistics
ISBN:
9781305504912
Author:
Frederick J Gravetter, Larry B. Wallnau
Publisher:
Cengage Learning
MATLAB: An Introduction with Applications
Statistics
ISBN:
9781119256830
Author:
Amos Gilat
Publisher:
John Wiley & Sons Inc
Probability and Statistics for Engineering and th…
Statistics
ISBN:
9781305251809
Author:
Jay L. Devore
Publisher:
Cengage Learning
Statistics for The Behavioral Sciences (MindTap C…
Statistics
ISBN:
9781305504912
Author:
Frederick J Gravetter, Larry B. Wallnau
Publisher:
Cengage Learning

Elementary Statistics: Picturing the World (7th E…
Statistics
ISBN:
9780134683416
Author:
Ron Larson, Betsy Farber
Publisher:
PEARSON

The Basic Practice of Statistics
Statistics
ISBN:
9781319042578
Author:
David S. Moore, William I. Notz, Michael A. Fligner
Publisher:
W. H. Freeman

Introduction to the Practice of Statistics
Statistics
ISBN:
9781319013387
Author:
David S. Moore, George P. McCabe, Bruce A. Craig
Publisher:
W. H. Freeman