The article "Snow Cover and Temperature Relationships in North America and Eurasia"t used statistical techniques to relate the amount of snow cover on each continent to average continental temperature. Data presented there included the following ten observations on October snow cover for Eurasia during the years 1970-1979 (in million km2): 6.5 12.0 14.9 10.0 10.7 7.9 21.9 12.5 14.5 9.2 What would you report as a representative, or typical, value of October snow cover for this period, and what prompted your choice? O The mean of this sample because the mean is always the best central measure. The mean of this sample because a potential outlier may produce a misleading median. The median of this sample because a potential outlier may produce a misleading mean. The median of this sample because the median is always the best central measure.
The article "Snow Cover and Temperature Relationships in North America and Eurasia"t used statistical techniques to relate the amount of snow cover on each continent to average continental temperature. Data presented there included the following ten observations on October snow cover for Eurasia during the years 1970-1979 (in million km2): 6.5 12.0 14.9 10.0 10.7 7.9 21.9 12.5 14.5 9.2 What would you report as a representative, or typical, value of October snow cover for this period, and what prompted your choice? O The mean of this sample because the mean is always the best central measure. The mean of this sample because a potential outlier may produce a misleading median. The median of this sample because a potential outlier may produce a misleading mean. The median of this sample because the median is always the best central measure.

Mathematics For Machine Technology
8th Edition
ISBN:9781337798310
Author:Peterson, John.
Publisher:Peterson, John.
Chapter29: Tolerance, Clearance, And Interference
Section: Chapter Questions
Problem 16A: Spacers are manufactured to the mean dimension and tolerance shown in Figure 29-12. An inspector...

Related questions
Question
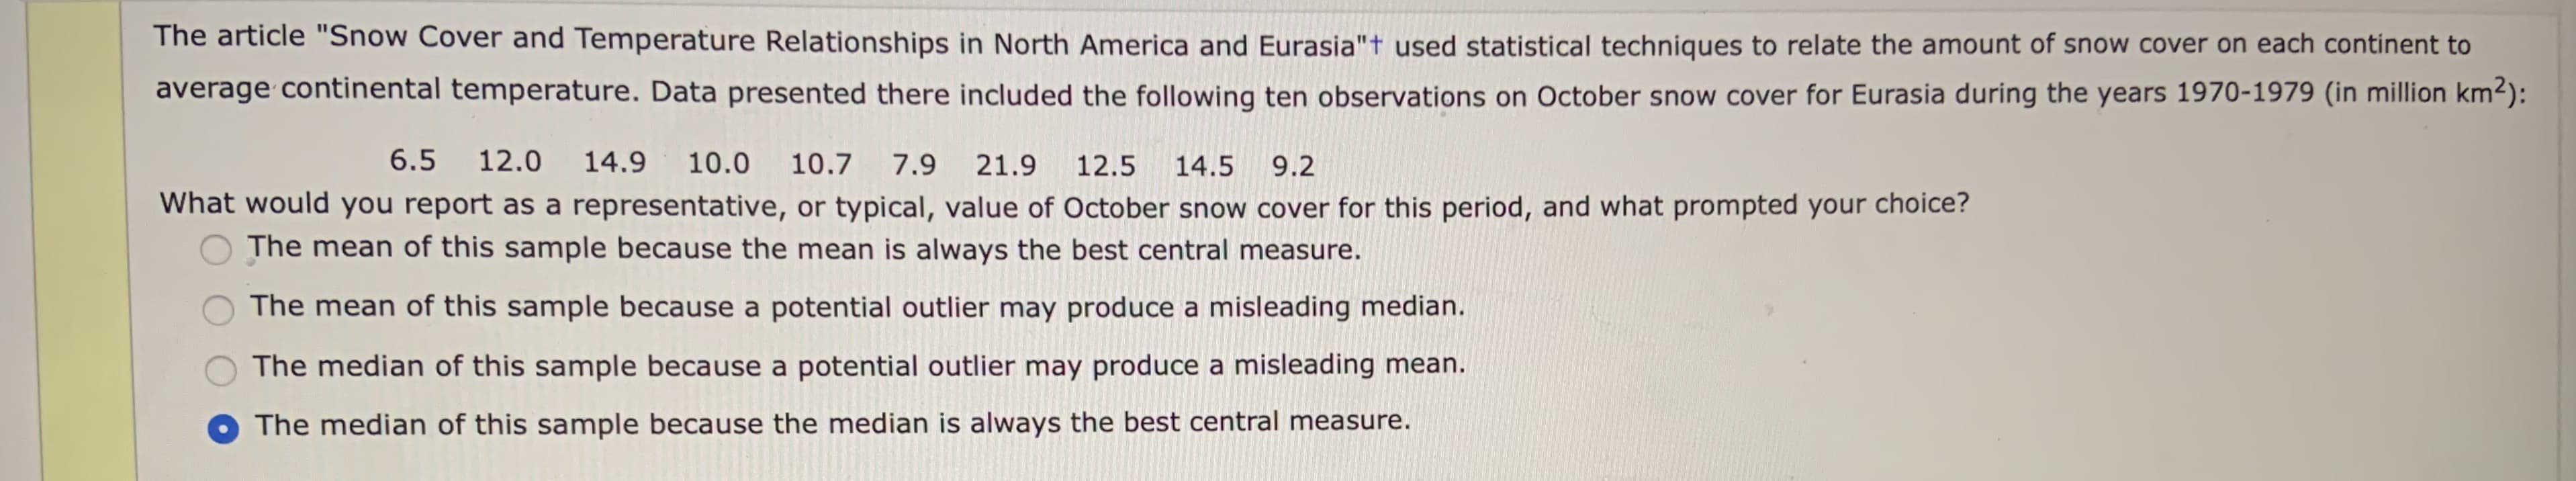
Transcribed Image Text:The article "Snow Cover and Temperature Relationships in North America and Eurasia"t used statistical techniques to relate the amount of snow cover on each continent to
average continental temperature. Data presented there included the following ten observations on October snow cover for Eurasia during the years 1970-1979 (in million km2):
6.5 12.0
14.9
10.0
10.7
7.9
21.9
12.5
14.5
9.2
What would you report as a representative, or typical, value of October snow cover for this period, and what prompted your choice?
O The mean of this sample because the mean is always the best central measure.
The mean of this sample because a potential outlier may produce a misleading median.
The median of this sample because a potential outlier may produce a misleading mean.
The median of this sample because the median is always the best central measure.
Expert Solution
This question has been solved!
Explore an expertly crafted, step-by-step solution for a thorough understanding of key concepts.

This is a popular solution!

Trending now
This is a popular solution!

Step by step
Solved in 2 steps with 2 images

Recommended textbooks for you
Mathematics For Machine Technology
Advanced Math
ISBN:
9781337798310
Author:
Peterson, John.
Publisher:
Cengage Learning,

Glencoe Algebra 1, Student Edition, 9780079039897…
Algebra
ISBN:
9780079039897
Author:
Carter
Publisher:
McGraw Hill
Mathematics For Machine Technology
Advanced Math
ISBN:
9781337798310
Author:
Peterson, John.
Publisher:
Cengage Learning,
Glencoe Algebra 1, Student Edition, 9780079039897…
Algebra
ISBN:
9780079039897
Author:
Carter
Publisher:
McGraw Hill