The article "Solid-Phase Chemical Fractionation of Selected Trace Metals in Some Northern Kentucky Soils" (A. Karathanasis and J. Pils, Soil and Sediment Contamination, 2005:293-308) presents pH measurements of soil specimens taken from three" different types of soils. The results in the following table are consistent with" means and standard deviations reported in the article. Soil Type pH Measurements Alluvium 6.53, 6.03, 6.75, 6.82, 6.24 Glacial 6.07, 6.07, 5.36, 5.57, 5.48, 5.27, 5.80, 5.03, 6.65 Till Residuum 6.03, 6.16, 6.63, 6.13, 6.05, 5.68, 6.25, 5.43, 6.46, 6.91, 5.75, 6.53 Construct an ANOVA table. You may give a range for the P-value. Can you conclude that there are differences among the mean pH levels? a. b.
The article "Solid-Phase Chemical Fractionation of Selected Trace Metals in Some Northern Kentucky Soils" (A. Karathanasis and J. Pils, Soil and Sediment Contamination, 2005:293-308) presents pH measurements of soil specimens taken from three" different types of soils. The results in the following table are consistent with" means and standard deviations reported in the article. Soil Type pH Measurements Alluvium 6.53, 6.03, 6.75, 6.82, 6.24 Glacial 6.07, 6.07, 5.36, 5.57, 5.48, 5.27, 5.80, 5.03, 6.65 Till Residuum 6.03, 6.16, 6.63, 6.13, 6.05, 5.68, 6.25, 5.43, 6.46, 6.91, 5.75, 6.53 Construct an ANOVA table. You may give a range for the P-value. Can you conclude that there are differences among the mean pH levels? a. b.

MATLAB: An Introduction with Applications
6th Edition
ISBN:9781119256830
Author:Amos Gilat
Publisher:Amos Gilat
Chapter1: Starting With Matlab
Section: Chapter Questions
Problem 1P

Related questions
Question
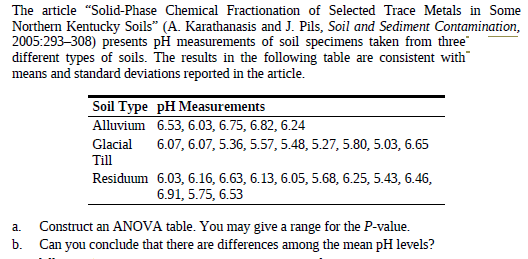
Transcribed Image Text:The article "Solid-Phase Chemical Fractionation of Selected Trace Metals in Some
Northern Kentucky Soils" (A. Karathanasis and J. Pils, Soil and Sediment Contamination,
2005:293-308) presents pH measurements of soil specimens taken from three"
different types of soils. The results in the following table are consistent with"
means and standard deviations reported in the article.
Soil Type pH Measurements
Alluvium 6.53, 6.03, 6.75, 6.82, 6.24
Glacial
6.07, 6.07, 5.36, 5.57, 5.48, 5.27, 5.80, 5.03, 6.65
Till
Residuum 6.03, 6.16, 6.63, 6.13, 6.05, 5.68, 6.25, 5.43, 6.46,
6.91, 5.75, 6.53
Construct an ANOVA table. You may give a range for the P-value.
Can you conclude that there are differences among the mean pH levels?
a.
b.
Expert Solution
This question has been solved!
Explore an expertly crafted, step-by-step solution for a thorough understanding of key concepts.

This is a popular solution!

Trending now
This is a popular solution!

Step by step
Solved in 4 steps with 4 images

Recommended textbooks for you
MATLAB: An Introduction with Applications
Statistics
ISBN:
9781119256830
Author:
Amos Gilat
Publisher:
John Wiley & Sons Inc

Probability and Statistics for Engineering and th…
Statistics
ISBN:
9781305251809
Author:
Jay L. Devore
Publisher:
Cengage Learning

Statistics for The Behavioral Sciences (MindTap C…
Statistics
ISBN:
9781305504912
Author:
Frederick J Gravetter, Larry B. Wallnau
Publisher:
Cengage Learning
MATLAB: An Introduction with Applications
Statistics
ISBN:
9781119256830
Author:
Amos Gilat
Publisher:
John Wiley & Sons Inc
Probability and Statistics for Engineering and th…
Statistics
ISBN:
9781305251809
Author:
Jay L. Devore
Publisher:
Cengage Learning
Statistics for The Behavioral Sciences (MindTap C…
Statistics
ISBN:
9781305504912
Author:
Frederick J Gravetter, Larry B. Wallnau
Publisher:
Cengage Learning

Elementary Statistics: Picturing the World (7th E…
Statistics
ISBN:
9780134683416
Author:
Ron Larson, Betsy Farber
Publisher:
PEARSON

The Basic Practice of Statistics
Statistics
ISBN:
9781319042578
Author:
David S. Moore, William I. Notz, Michael A. Fligner
Publisher:
W. H. Freeman

Introduction to the Practice of Statistics
Statistics
ISBN:
9781319013387
Author:
David S. Moore, George P. McCabe, Bruce A. Craig
Publisher:
W. H. Freeman