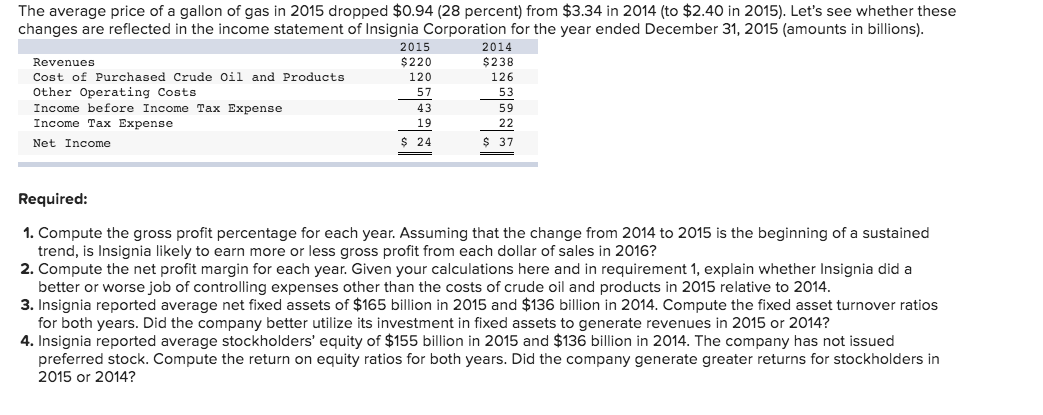
The average price of a gallon of gas in 2015 dropped $0.94 (28 percent) from $3.34 in 2014 (to $2.40 in 2015). Let's see whether these changes are reflected in the income statement of Insignia Corporation for the year ended December 31, 2015 (amounts in billions). 2015 $220 2014 $238 Revenues Cost of Purchased Crude Oil and Products 120 126 Other Operating Costs Income before Income Tax Expense Income Tax Expense 57 53 43 59 19 22 Net Income $ 24 $ 37 Required: 1. Compute the gross profit percentage for each year. Assuming that the change from 2014 to 2015 is the beginning of a sustained trend, is Insignia likely to earn more or less gross profit from each dollar of sales in 2016? 2. Compute the net profit margin for each year. Given your calculations here and in requirement 1, explain whether Insignia did a better or worse job of controlling expenses other than the costs of crude oil and products in 2015 relative to 2014. 3. Insignia reported average net fixed assets of $165 billion in 2015 and $136 billion in 2014. Compute the fixed asset turnover ratios for both years. Did the company better utilize its investment in fixed assets to generate revenues in 2015 or 2014?
The average price of a gallon of gas in 2015 dropped $0.94 (28 percent) from $3.34 in 2014 (to $2.40 in 2015). Let's see whether these changes are reflected in the income statement of Insignia Corporation for the year ended December 31, 2015 (amounts in billions). 2015 $220 2014 $238 Revenues Cost of Purchased Crude Oil and Products 120 126 Other Operating Costs Income before Income Tax Expense Income Tax Expense 57 53 43 59 19 22 Net Income $ 24 $ 37 Required: 1. Compute the gross profit percentage for each year. Assuming that the change from 2014 to 2015 is the beginning of a sustained trend, is Insignia likely to earn more or less gross profit from each dollar of sales in 2016? 2. Compute the net profit margin for each year. Given your calculations here and in requirement 1, explain whether Insignia did a better or worse job of controlling expenses other than the costs of crude oil and products in 2015 relative to 2014. 3. Insignia reported average net fixed assets of $165 billion in 2015 and $136 billion in 2014. Compute the fixed asset turnover ratios for both years. Did the company better utilize its investment in fixed assets to generate revenues in 2015 or 2014?

Chapter12: Corporate Valuation And Financial Planning
Section: Chapter Questions
Problem 6P

Related questions

Question
Transcribed Image Text:The average price of a gallon of gas in 2015 dropped $0.94 (28 percent) from $3.34 in 2014 (to $2.40 in 2015). Let's see whether these
changes are reflected in the income statement of Insignia Corporation for the year ended December 31, 2015 (amounts in billions).
2015
$220
2014
$238
Revenues
Cost of Purchased Crude Oil and Products
Other Operating Costs
Income before Income Tax Expense
Income Tax Expense
120
126
57
53
43
59
19
22
Net Income
$ 24
$ 37
Required:
1. Compute the gross profit percentage for each year. Assuming that the change from 2014 to 2015 is the beginning of a sustained
trend, is Insignia likely to earn more or less gross profit from each dollar of sales in 2016?
2. Compute the net profit margin for each year. Given your calculations here and in requirement 1, explain whether Insignia did a
better or worse job of controlling expenses other than the costs of crude oil and products in 2015 relative to 2014.
3. Insignia reported average net fixed assets of $165 billion in 2015 and $136 billion in 2014. Compute the fixed asset turnover ratios
for both years. Did the company better utilize its investment in fixed assets to generate revenues in 2015 or 2014?
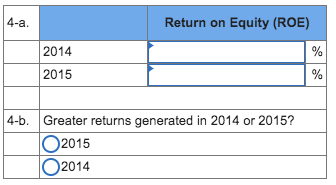
4. Insignia reported average stockholders' equity of $155 billion in 2015 and $136 billion in 2014. The company has not issued
preferred stock. Compute the return on equity ratios for both years. Did the company generate greater returns for stockholders in
2015 or 2014?
Transcribed Image Text:4-a.
Return on Equity (ROE)
2014
%
2015
%
4-b. Greater returns generated in 2014 or 2015?
O2015
O2014
Expert Solution
This question has been solved!
Explore an expertly crafted, step-by-step solution for a thorough understanding of key concepts.

This is a popular solution!

Trending now
This is a popular solution!

Step by step
Solved in 4 steps with 3 images

Knowledge Booster


Learn more about
Need a deep-dive on the concept behind this application? Look no further. Learn more about this topic, accounting and related others by exploring similar questions and additional content below.Recommended textbooks for you