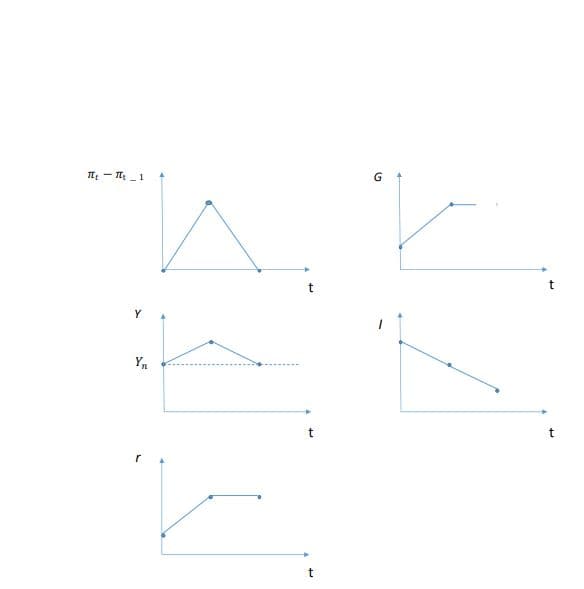
The below five graphs show the development of key macroeconomic variables over the scope of three year in a certain country. Use them to draw an IS-LM-PC graph that captures the development in this country. Explain carefully what has happened.
The below five graphs show the development of key macroeconomic variables over the scope of three year in a certain country. Use them to draw an IS-LM-PC graph that captures the development in this country. Explain carefully what has happened.

Macroeconomics: Principles and Policy (MindTap Course List)
13th Edition
ISBN:9781305280601
Author:William J. Baumol, Alan S. Blinder
Publisher:William J. Baumol, Alan S. Blinder
Chapter5: An Introduction To Macroeconomics
Section: Chapter Questions
Problem 1TY

Related questions
Question
Transcribed Image Text:I - 1
G
Y
Yn
Transcribed Image Text:The below five graphs show the development of key macroeconomic variables over the
scope of three year in a certain country. Use them to draw an IS-LM-PC graph that
captures the development in this country. Explain carefully what has happened.
Expert Solution
This question has been solved!
Explore an expertly crafted, step-by-step solution for a thorough understanding of key concepts.

Step by step
Solved in 6 steps with 5 images

Knowledge Booster


Learn more about
Need a deep-dive on the concept behind this application? Look no further. Learn more about this topic, economics and related others by exploring similar questions and additional content below.Recommended textbooks for you
Macroeconomics: Principles and Policy (MindTap Co…
Economics
ISBN:
9781305280601
Author:
William J. Baumol, Alan S. Blinder
Publisher:
Cengage Learning

Macroeconomics: Principles and Policy (MindTap Co…
Economics
ISBN:
9781305280601
Author:
William J. Baumol, Alan S. Blinder
Publisher:
Cengage Learning