The CEO of a cable company claims that the mean wait time for callers at the company's customer service center is no more than 7 minutes. A random sample of 36 customers who called the company's customer service center has a mean wait time of 8.03 minutes with a standard deviation of 2.14 minutes. Using an alternative hypothesis Ha : 7, find the p-value range for the appropriate hypothesis test. Values for right-tail areas under the t-distribution curve 0.01 Probability Degrees of Freedom 30 0.10 0.05 0.025 0.005 1.310 1.309 1.309 1.308 1.307 1.306 1.306 1.305 1.304 1.304 1.303 1.697 1.696 1.694 1.692 1.691 1.690 1.688 1.687 1.686 1.685 1.684 2.042 2.040 2.037 2.035 2.032 2.030 2.028 2.026 2.024 2.023 2.021 2.457 2.453 2.449 2.445 2.441 2.438 2.434 2.431 2.429 2.426 2.423 2.750 2.744 2.738 2.733 2.728 2.724 2.719 2.715 2.712 2.708 2.704 32 34 35 36 37 38 39 40
The CEO of a cable company claims that the mean wait time for callers at the company's customer service center is no more than 7 minutes. A random sample of 36 customers who called the company's customer service center has a mean wait time of 8.03 minutes with a standard deviation of 2.14 minutes. Using an alternative hypothesis Ha : 7, find the p-value range for the appropriate hypothesis test. Values for right-tail areas under the t-distribution curve 0.01 Probability Degrees of Freedom 30 0.10 0.05 0.025 0.005 1.310 1.309 1.309 1.308 1.307 1.306 1.306 1.305 1.304 1.304 1.303 1.697 1.696 1.694 1.692 1.691 1.690 1.688 1.687 1.686 1.685 1.684 2.042 2.040 2.037 2.035 2.032 2.030 2.028 2.026 2.024 2.023 2.021 2.457 2.453 2.449 2.445 2.441 2.438 2.434 2.431 2.429 2.426 2.423 2.750 2.744 2.738 2.733 2.728 2.724 2.719 2.715 2.712 2.708 2.704 32 34 35 36 37 38 39 40

MATLAB: An Introduction with Applications
6th Edition
ISBN:9781119256830
Author:Amos Gilat
Publisher:Amos Gilat
Chapter1: Starting With Matlab
Section: Chapter Questions
Problem 1P

Related questions

Question
100%
Select the correct answer below:
0.025< p-value <0.05
0.005< p-value <0.01
p-value <0.005
0.01< p-value <0.025
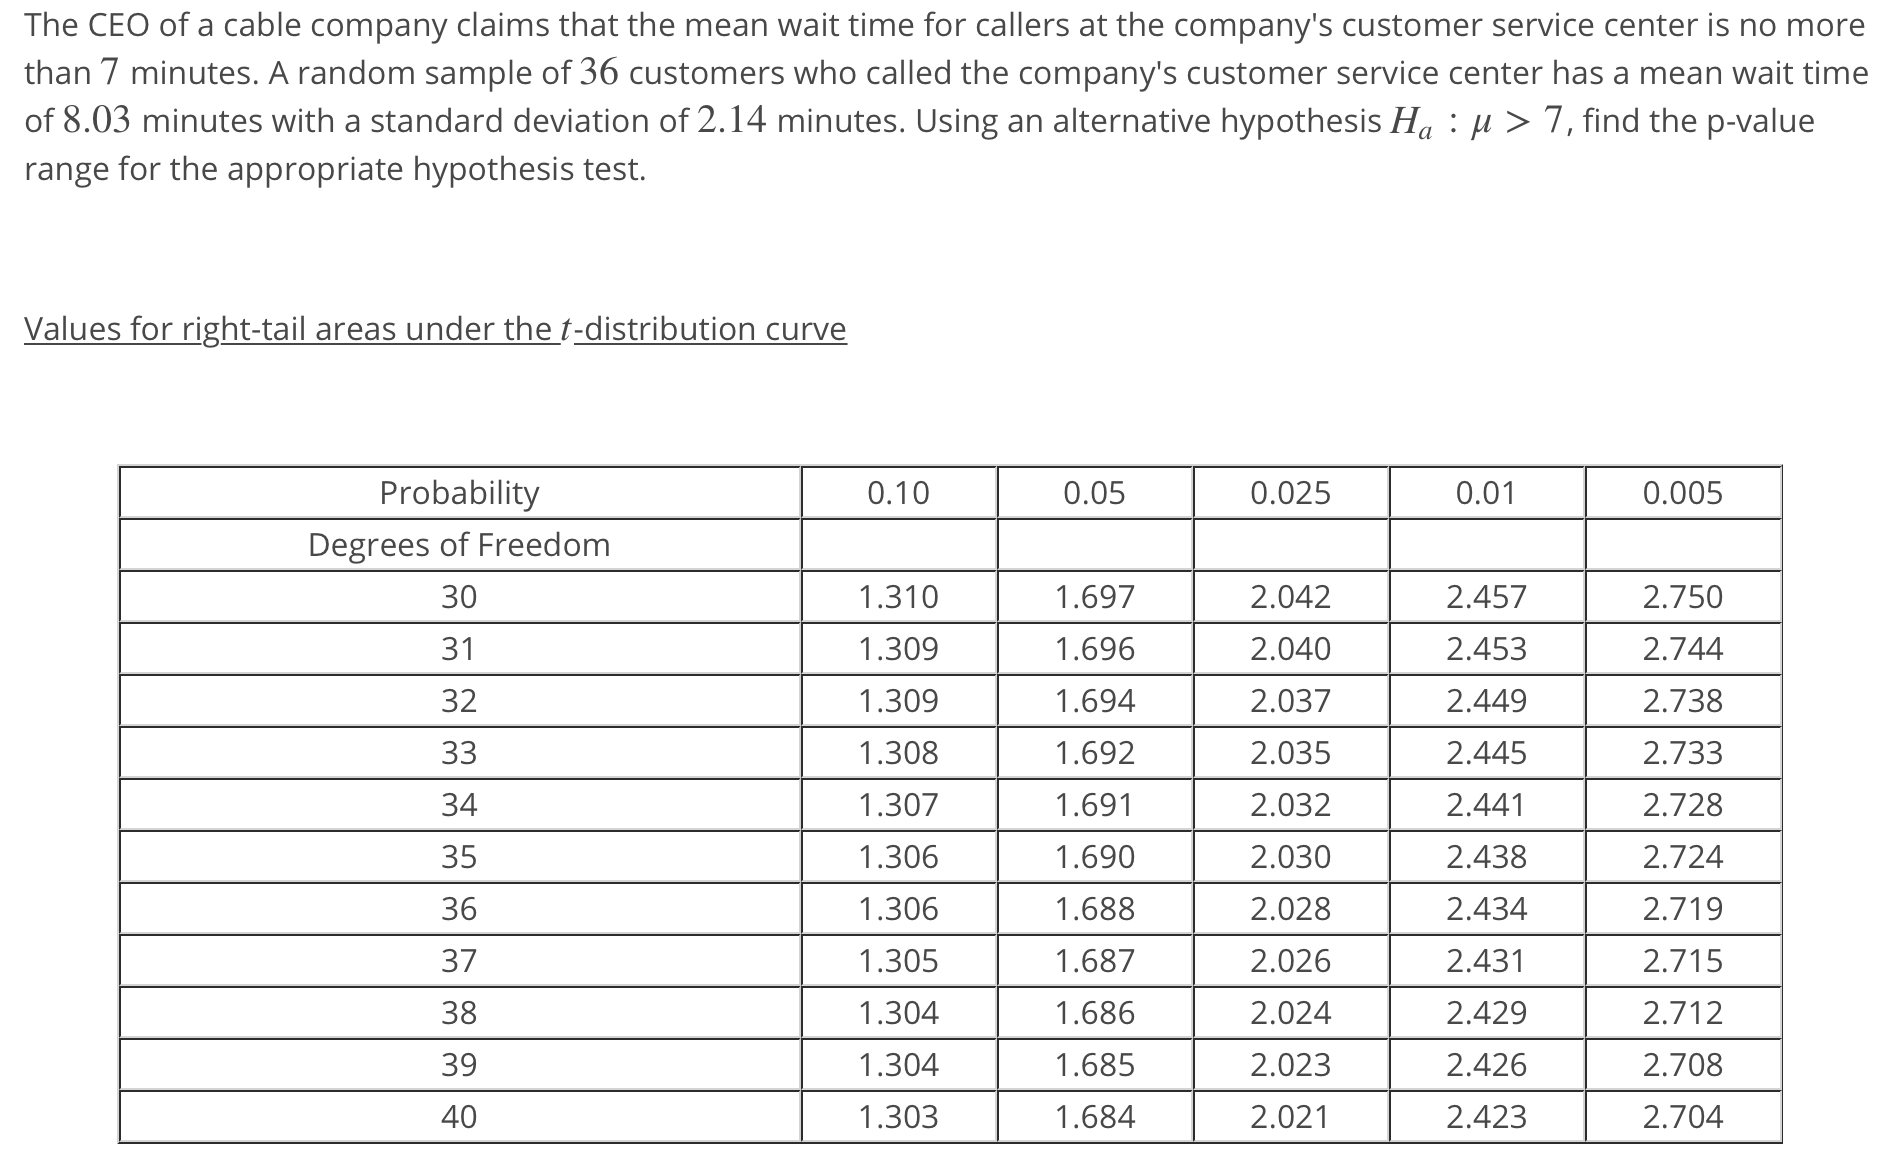
Transcribed Image Text:The CEO of a cable company claims that the mean wait time for callers at the company's customer service center is no more
than 7 minutes. A random sample of 36 customers who called the company's customer service center has a mean wait time
of 8.03 minutes with a standard deviation of 2.14 minutes. Using an alternative hypothesis Ha : 7, find the p-value
range for the appropriate hypothesis test.
Values for right-tail areas under the t-distribution curve
0.01
Probability
Degrees of Freedom
30
0.10
0.05
0.025
0.005
1.310
1.309
1.309
1.308
1.307
1.306
1.306
1.305
1.304
1.304
1.303
1.697
1.696
1.694
1.692
1.691
1.690
1.688
1.687
1.686
1.685
1.684
2.042
2.040
2.037
2.035
2.032
2.030
2.028
2.026
2.024
2.023
2.021
2.457
2.453
2.449
2.445
2.441
2.438
2.434
2.431
2.429
2.426
2.423
2.750
2.744
2.738
2.733
2.728
2.724
2.719
2.715
2.712
2.708
2.704
32
34
35
36
37
38
39
40
Expert Solution
This question has been solved!
Explore an expertly crafted, step-by-step solution for a thorough understanding of key concepts.

This is a popular solution!

Trending now
This is a popular solution!

Step by step
Solved in 3 steps with 2 images

Knowledge Booster


Learn more about
Need a deep-dive on the concept behind this application? Look no further. Learn more about this topic, statistics and related others by exploring similar questions and additional content below.Recommended textbooks for you
MATLAB: An Introduction with Applications
Statistics
ISBN:
9781119256830
Author:
Amos Gilat
Publisher:
John Wiley & Sons Inc

Probability and Statistics for Engineering and th…
Statistics
ISBN:
9781305251809
Author:
Jay L. Devore
Publisher:
Cengage Learning

Statistics for The Behavioral Sciences (MindTap C…
Statistics
ISBN:
9781305504912
Author:
Frederick J Gravetter, Larry B. Wallnau
Publisher:
Cengage Learning
MATLAB: An Introduction with Applications
Statistics
ISBN:
9781119256830
Author:
Amos Gilat
Publisher:
John Wiley & Sons Inc
Probability and Statistics for Engineering and th…
Statistics
ISBN:
9781305251809
Author:
Jay L. Devore
Publisher:
Cengage Learning
Statistics for The Behavioral Sciences (MindTap C…
Statistics
ISBN:
9781305504912
Author:
Frederick J Gravetter, Larry B. Wallnau
Publisher:
Cengage Learning

Elementary Statistics: Picturing the World (7th E…
Statistics
ISBN:
9780134683416
Author:
Ron Larson, Betsy Farber
Publisher:
PEARSON

The Basic Practice of Statistics
Statistics
ISBN:
9781319042578
Author:
David S. Moore, William I. Notz, Michael A. Fligner
Publisher:
W. H. Freeman

Introduction to the Practice of Statistics
Statistics
ISBN:
9781319013387
Author:
David S. Moore, George P. McCabe, Bruce A. Craig
Publisher:
W. H. Freeman