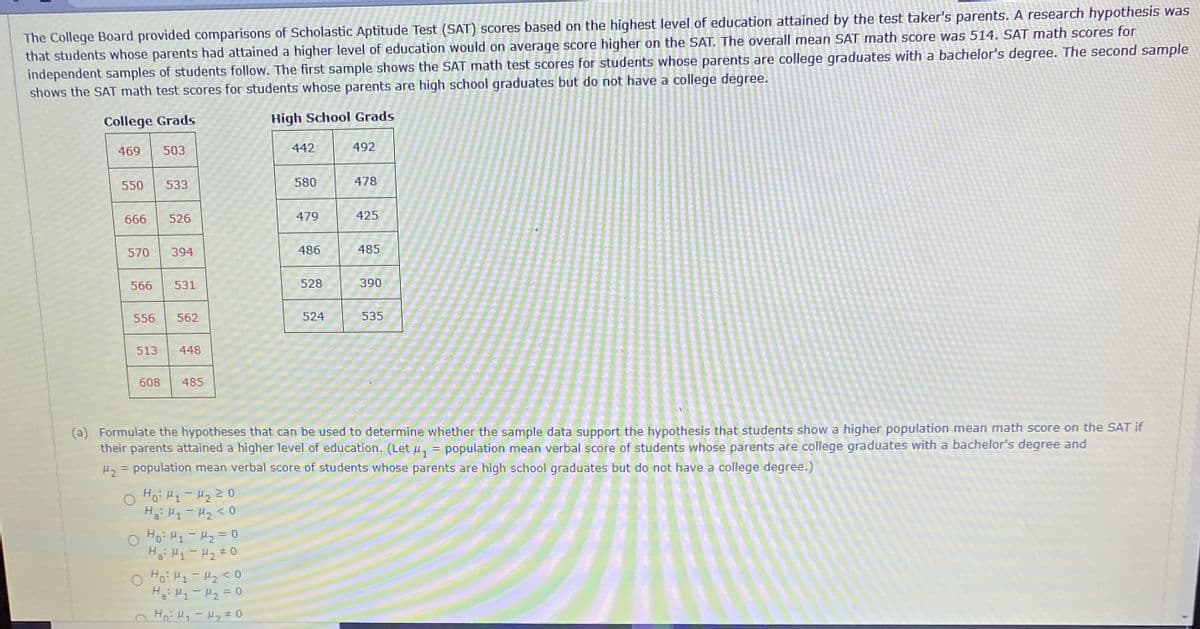
The College Board provided comparisons of Scholastic Aptitude Test (SAT) scores based on the highest level of education attained by the test taker's parents. A research hypothesis was that students whose parents had attained a higher level of education would on average score higher on the SAT. The overall mean SAT math score was 514. SAT math scores for independent samples of students follow. The first sample shows the SAT math test scores for students whose parents are college graduates with a bachelor's degree. The second sample shows the SAT math test scores for students whose parents are high school graduates but do not have a college degree. College Grads High School Grads 469 503 442 492 550 533 580 478 666 526 479 425 570 394 486 485 566 531 528 390 556 562 524 535 513 448 608 485
The College Board provided comparisons of Scholastic Aptitude Test (SAT) scores based on the highest level of education attained by the test taker's parents. A research hypothesis was that students whose parents had attained a higher level of education would on average score higher on the SAT. The overall mean SAT math score was 514. SAT math scores for independent samples of students follow. The first sample shows the SAT math test scores for students whose parents are college graduates with a bachelor's degree. The second sample shows the SAT math test scores for students whose parents are high school graduates but do not have a college degree. College Grads High School Grads 469 503 442 492 550 533 580 478 666 526 479 425 570 394 486 485 566 531 528 390 556 562 524 535 513 448 608 485

Glencoe Algebra 1, Student Edition, 9780079039897, 0079039898, 2018
18th Edition
ISBN:9780079039897
Author:Carter
Publisher:Carter
Chapter10: Statistics
Section10.3: Measures Of Spread
Problem 1GP

Related questions
Topic Video
Question
Transcribed Image Text:The College Board provided comparisons of Scholastic Aptitude Test (SAT) scores based on the highest level of education attained by the test taker's parents. A research hypothesis was
that students whose parents had attained a higher level of education would on average score higher on the SAT. The overall mean SAT math score was 514. SAT math scores for
independent samples of students follow. The first sample shows the SAT math test scores for students whose parents are college graduates with a bachelor's degree. The second sample
shows the SAT math test scores for students whose parents are high school graduates but do not have a college degree.
College Grads
High School Grads
469
503
442
492
550
533
580
478
666
526
479
425
570
394
486
485
566
531
528
390
556
562
524
535
513
448
608
485
(a) Formulate the hypotheses that can be used to determine whether the sample data support the hypothesis that students show a higher population mean math score on the SAT if
their parents attained a higher level of education. (Let u, = population mean verbal score of students whose parents are college graduates with a bachelor's degree and
u, = population mean verbal score of students whose parents are high school graduates but do not have a college degree.)
O Ho: H1- H2 2 0
O Ho: H1 - H2 = 0
O Ho: H1- H2 <0
Transcribed Image Text:o Ho: H1-H220
O Ho: H1- H2 = 0
O Ho: H1-Hz<0
H H- H2=D0
O Ho: H1-Hz#0
%3D
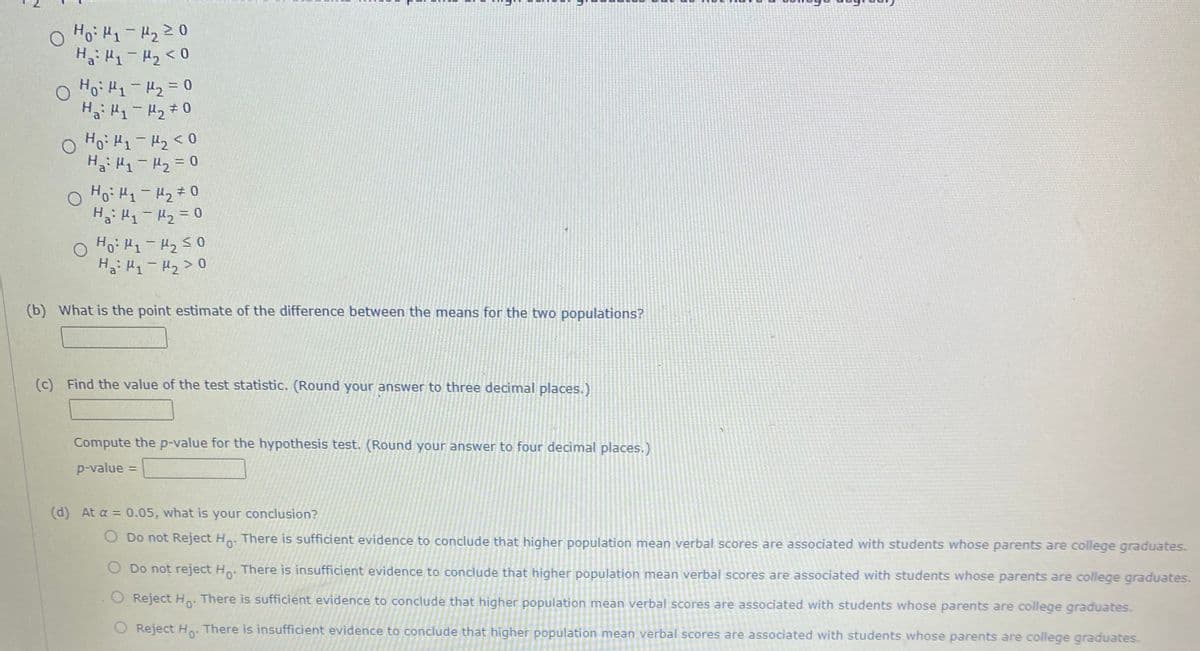
(b) What is the point estimate of the difference between the means for the two populations?
(c) Find the value of the test statistic. (Round your answer to three decimal places.)
Compute the p-value for the hypothesis test. (Round your answer to four decimal places.)
p-value
(d) At a = 0.05, what is your conclusion?
O Do not Reject H There is sufficient evidence to conclude that higher population mean verbal scores are associated with students whose parents are college graduates.
O Do not reject H There is insufficient evidence to conclude that higher population mean verbal scores are associated with students whose parents are college graduates.
O Reject H. There is sufficient evidence to conclude that higher population mean verbal scores are associated with students whose parents are college graduates.
O Reject Ho-
There is insufficient evidence to conclude that higher population mean verbal scores are associated with students whose parents are college graduates.
Expert Solution
This question has been solved!
Explore an expertly crafted, step-by-step solution for a thorough understanding of key concepts.

This is a popular solution!

Trending now
This is a popular solution!

Step by step
Solved in 2 steps with 1 images

Knowledge Booster


Learn more about
Need a deep-dive on the concept behind this application? Look no further. Learn more about this topic, statistics and related others by exploring similar questions and additional content below.Recommended textbooks for you
Glencoe Algebra 1, Student Edition, 9780079039897…
Algebra
ISBN:
9780079039897
Author:
Carter
Publisher:
McGraw Hill

College Algebra (MindTap Course List)
Algebra
ISBN:
9781305652231
Author:
R. David Gustafson, Jeff Hughes
Publisher:
Cengage Learning

Glencoe Algebra 1, Student Edition, 9780079039897…
Algebra
ISBN:
9780079039897
Author:
Carter
Publisher:
McGraw Hill
College Algebra (MindTap Course List)
Algebra
ISBN:
9781305652231
Author:
R. David Gustafson, Jeff Hughes
Publisher:
Cengage Learning