The data below gives the mean price (in cents) of a litre of regular gasoline at self-service filling stations at a sample of six urban centres in Canada in May 2010. Urban area Price/litre Halifax 105.4 Thunder Bay Winnipeg Calgary 109.2 98.8 94.9 Victoria 109.7 Whitehorse 112.5 Provide answers to the following to two decimal places. Part (a) Find the sample mean (in cents). Part (b) Find the sample standard deviation (in cents). Part (c) Using the appropriate t distribution, find a 90% confidence interval for the mean gasoline price per litre across urban Canada in May 2010. Provide the upper and lower bounds for your confidence interval. ( Part (d) Would a 95% confidence interval be wider or narrower than the interval you found in Part (c)? Using the appropriate t distribution, find a 95% confidence interval for the mean gasoline price per litre across urban Canada in May 2010. Provide the upper and lower bounds for your confidence interval. (
The data below gives the mean price (in cents) of a litre of regular gasoline at self-service filling stations at a sample of six urban centres in Canada in May 2010. Urban area Price/litre Halifax 105.4 Thunder Bay Winnipeg Calgary 109.2 98.8 94.9 Victoria 109.7 Whitehorse 112.5 Provide answers to the following to two decimal places. Part (a) Find the sample mean (in cents). Part (b) Find the sample standard deviation (in cents). Part (c) Using the appropriate t distribution, find a 90% confidence interval for the mean gasoline price per litre across urban Canada in May 2010. Provide the upper and lower bounds for your confidence interval. ( Part (d) Would a 95% confidence interval be wider or narrower than the interval you found in Part (c)? Using the appropriate t distribution, find a 95% confidence interval for the mean gasoline price per litre across urban Canada in May 2010. Provide the upper and lower bounds for your confidence interval. (

Glencoe Algebra 1, Student Edition, 9780079039897, 0079039898, 2018
18th Edition
ISBN:9780079039897
Author:Carter
Publisher:Carter
Chapter10: Statistics
Section10.4: Distributions Of Data
Problem 19PFA

Related questions
Question
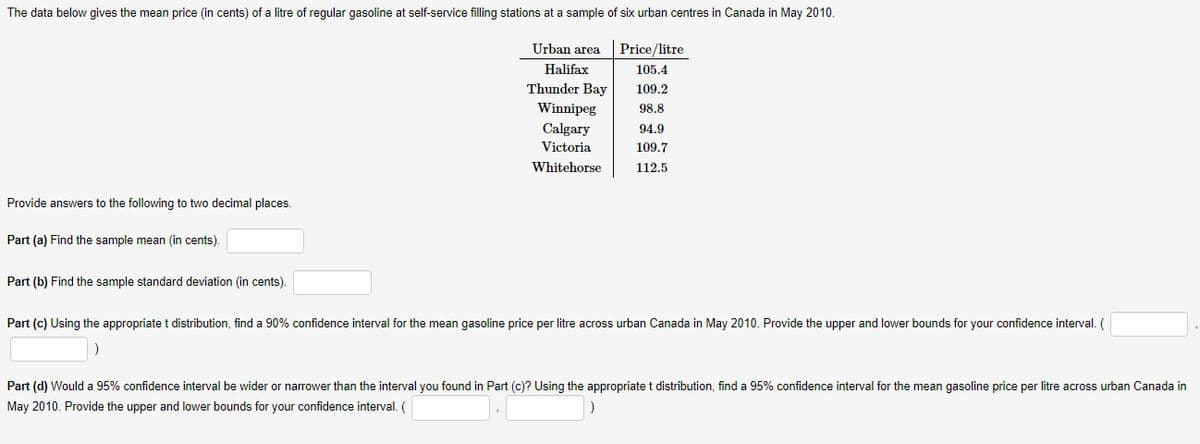
Transcribed Image Text:The data below gives the mean price (in cents) of a litre of regular gasoline at self-service filling stations at a sample of six urban centres in Canada in May 2010.
Urban area
Price/litre
Halifax
105.4
Thunder Bay
109.2
Winnipeg
98,8
Calgary
94.9
Victoria
109.7
Whitehorse
112.5
Provide answers to the following to two decimal places.
Part (a) Find the sample mean (in cents).
Part (b) Find the sample standard deviation (in cents).
Part (c) Using the appropriate t distribution, find a 90% confidence interval for the mean gasoline price per litre across urban Canada in May 2010. Provide the upper and lower bounds for your confidence interval. (
Part (d) Would a 95% confidence interval be wider or narrower than the interval you found in Part (c)? Using the appropriate t distribution, find a 95% confidence interval for the mean gasoline price per litre across urban Canada in
May 2010. Provide the upper and lower bounds for your confidence interval. (
Expert Solution
This question has been solved!
Explore an expertly crafted, step-by-step solution for a thorough understanding of key concepts.

This is a popular solution!

Trending now
This is a popular solution!

Step by step
Solved in 5 steps

Recommended textbooks for you
Glencoe Algebra 1, Student Edition, 9780079039897…
Algebra
ISBN:
9780079039897
Author:
Carter
Publisher:
McGraw Hill
Glencoe Algebra 1, Student Edition, 9780079039897…
Algebra
ISBN:
9780079039897
Author:
Carter
Publisher:
McGraw Hill