The data given below indicate the existence of a linear relationship between thex and y variables. Suppose an analyst who prepared the solutions and coried out the RI measurements was not skilled and as a result of poor technique, allowed intemediate errors to appear. The resuits are the following Concentration of solution in percent ( 10 26 33 50 61 Refractive indices ty) 1.497 1.493 1.485 1478 1.477 Step 1. Carefully piot the given x and y values (from the tabie) on a regular graphing paper (or milimeter graphing poper - it avaiable, preferred for precision). Label then connect the points to observe a zigzog plot due to the scattered points. Slep 2. Copy and fil the given table (belowjon the top part of your grophing paper, after your student detais to commence with inear regression. For uniformity, ALL computed values to be filed in this tabie wil be rounded-off to the 3 decimal place. The values obtained in this table are REAL numbers with either positive or negative integers). to be included in the summation for each column. For answers withexponents, copy the base number in decimal form up to the 3 decimal ploce then add the "x10" (example: 1.234x 10). Since this is a guided quiz. Ihave included some answers in red ink) to help you through the activity, Remember. "there is no shortcut to success". Double check answers before proceeding (x - X) (x - X)2 676.000 (y - 9) 0.011 (y - 9) 1.210x10⁴ (x - X) (y - ý) 10 -26.000 1.497 -0.286 26 1.493 33 1.485 50 1.478 61 1.477 E= 180.000 E= E=7.430 Σ -EviN =36.000
The data given below indicate the existence of a linear relationship between thex and y variables. Suppose an analyst who prepared the solutions and coried out the RI measurements was not skilled and as a result of poor technique, allowed intemediate errors to appear. The resuits are the following Concentration of solution in percent ( 10 26 33 50 61 Refractive indices ty) 1.497 1.493 1.485 1478 1.477 Step 1. Carefully piot the given x and y values (from the tabie) on a regular graphing paper (or milimeter graphing poper - it avaiable, preferred for precision). Label then connect the points to observe a zigzog plot due to the scattered points. Slep 2. Copy and fil the given table (belowjon the top part of your grophing paper, after your student detais to commence with inear regression. For uniformity, ALL computed values to be filed in this tabie wil be rounded-off to the 3 decimal place. The values obtained in this table are REAL numbers with either positive or negative integers). to be included in the summation for each column. For answers withexponents, copy the base number in decimal form up to the 3 decimal ploce then add the "x10" (example: 1.234x 10). Since this is a guided quiz. Ihave included some answers in red ink) to help you through the activity, Remember. "there is no shortcut to success". Double check answers before proceeding (x - X) (x - X)2 676.000 (y - 9) 0.011 (y - 9) 1.210x10⁴ (x - X) (y - ý) 10 -26.000 1.497 -0.286 26 1.493 33 1.485 50 1.478 61 1.477 E= 180.000 E= E=7.430 Σ -EviN =36.000

Algebra & Trigonometry with Analytic Geometry
13th Edition
ISBN:9781133382119
Author:Swokowski
Publisher:Swokowski
Chapter5: Inverse, Exponential, And Logarithmic Functions
Section5.6: Exponential And Logarithmic Equations
Problem 53E

Related questions
Question
Transcribed Image Text:X- 36.000
9-1.456
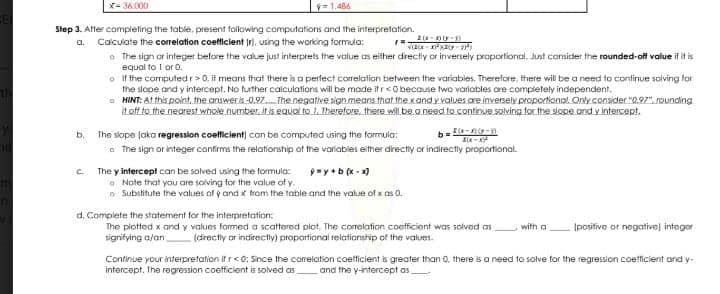
Step 3. After compleling the table, present following computations and the interpretation.
Calculate the correlation coetticient Ir). using the working formula:
o The sign or integer before the value just interprets the value as either directly or inversely proportional. Just consider the rounded-off value il it is
equal to I or 0.
o If the computedr>0, it means that there is a perfect correlation between the variables. Therefore, there will be a need to continue solving for
the slope and y intercept, No further calculations will be made it r<O becouse two variables are completely independent.
O HINT: ALthis point, the answeris-0.97. The negative sign means that the xand y values are inversely proportional. Only.consider "0.97", rounding
it off to the nearest whole number, it is equal to 1. Therefore, there will be a need to continue solving tor the slope and y intercept.
a.
The slope (aka regression coefficient) can be computed using the formulo:
o The sign or integer confirms the relatiorship of the variables either directly or indirectly proportional.
b.
c.
ay +b (x - )
The y intercept can be solved using the formula:
O Note that you are solving for the value of y.
o Substitute the values af y and x from the table and the value of x as 0.
d. Complete the statement for the interpretation:
The piotted x ond y values farmed a scattered plot. The correiation coefficient was solved as
signitying a/an
with a
Ipositive or negative) integor
(directly or indirectly) proportional relationship of the values.
Continue your interpretation if r<0: Since the corelation coetficient is greater than 0, there is a need to solve for the regression coefficient and y-
intercept. The regression coefficient is solved as and the y-intercept as
Transcribed Image Text:Linear Regression
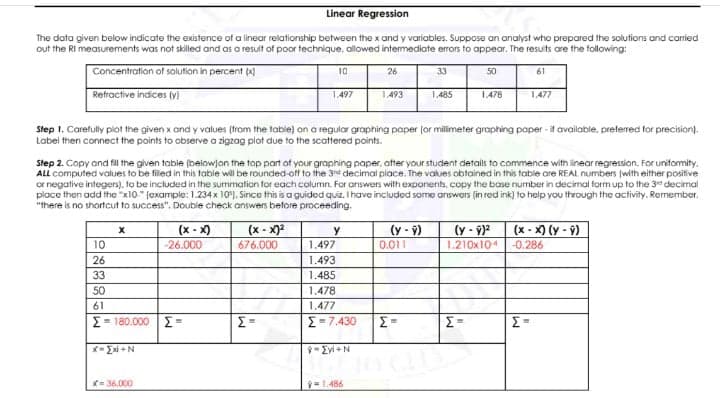
The data given below indicate the existence of a linear relationship between the x and y variables. Suppose an analyst who prepared the solutions and carried
out the RI measurements was not skilled and as a result of poor technique, ollowed intemediate errors to appear. The resuts are the following:
Concentration of solution in percent
10
26
33
50
61
Refractive indices (y)
1.497
1.493
1.485
1.478
1.477
Step 1. Carefully piot the given x and y values (from the table) on a regular graphing paper (or milimeter graphing poper - it available, preferred for precision).
Label then connect the points to observe a zigzag plot due to the scattered points.
Step 2. Copy and fill the given table (belowjon the top part of your graphing paper, atter your student details to commence with linear regression. For unifomity.
ALL computed values to be filed in this table will be rounded-off to the 3rd decimal place. The values obtained in this table are REAL numbers (with either positive
or negative integers), to be included in the summation for each column. For answers with exponents, copy the base number in decimal form up to the 3 decimal
ploce then add the "x10" (example: 1.234 x 10). Since this is a guided quiz, I have included some answers (in red ink) to help you through the activity, Rormember.
"there is no shortcut to success". Doubie check answers before proceeding.
(y - 9)
0.011
(x - x) (y-9)
(x - X)
(x - X)2
(y-9)2
1.210x10⁴-0.286
y
10
-26.000
676.000
1.497
26
1.493
33
1.485
50
1.478
61
1.477
Σ-180.000 | Σ
Σ-7.430
*- Exi +N
- Evi +N
= 36.000
= 1.486
Expert Solution
This question has been solved!
Explore an expertly crafted, step-by-step solution for a thorough understanding of key concepts.

Step by step
Solved in 6 steps with 1 images

Recommended textbooks for you
Algebra & Trigonometry with Analytic Geometry
Algebra
ISBN:
9781133382119
Author:
Swokowski
Publisher:
Cengage

Mathematics For Machine Technology
Advanced Math
ISBN:
9781337798310
Author:
Peterson, John.
Publisher:
Cengage Learning,

Algebra: Structure And Method, Book 1
Algebra
ISBN:
9780395977224
Author:
Richard G. Brown, Mary P. Dolciani, Robert H. Sorgenfrey, William L. Cole
Publisher:
McDougal Littell
Algebra & Trigonometry with Analytic Geometry
Algebra
ISBN:
9781133382119
Author:
Swokowski
Publisher:
Cengage
Mathematics For Machine Technology
Advanced Math
ISBN:
9781337798310
Author:
Peterson, John.
Publisher:
Cengage Learning,
Algebra: Structure And Method, Book 1
Algebra
ISBN:
9780395977224
Author:
Richard G. Brown, Mary P. Dolciani, Robert H. Sorgenfrey, William L. Cole
Publisher:
McDougal Littell