The data in the accompanying table are from a paper. Suppose that each person in a random sample of 47 male students and in a random sample of 89 female students at a particular college was classified according to gender and whether they usually rarely eat three meals a day. Usually Eat 3 Meals a Day Rarely Eat 3 Meals a Day Male 25 22 Female 37 52 (a) Is there evidence that the proportions who would fall into each of the two response categories are not the same for males and females? Use the X statistic to test the relevant hypotheses with a significance level of a - 0.05. State the appropriate null and alternative hypotheses. O H,: The proportions falling into the two response categories are the same for males and females. H: The proportions falling into the two response categories are not the same for males and females. O H: The proportions falling into the two response categories are not the same for males and females. H: The proportions falling into the two response categories are the same for males and females. O H,: The proportions falling into the two response categories are 0.5 for both males and females. H: The proportions falling into the two response categories are not 0.5 for both males and females. O H: The proportions falling into the two response categories are not 0.5 for both males and females. H: The proportions falling into the two response categories are 0.5 for both males and females. Find the test statistic and P-value. (Use technology. Round your test statistic to three decimal places and your P-value to four decimal places.) P-value =
The data in the accompanying table are from a paper. Suppose that each person in a random sample of 47 male students and in a random sample of 89 female students at a particular college was classified according to gender and whether they usually rarely eat three meals a day. Usually Eat 3 Meals a Day Rarely Eat 3 Meals a Day Male 25 22 Female 37 52 (a) Is there evidence that the proportions who would fall into each of the two response categories are not the same for males and females? Use the X statistic to test the relevant hypotheses with a significance level of a - 0.05. State the appropriate null and alternative hypotheses. O H,: The proportions falling into the two response categories are the same for males and females. H: The proportions falling into the two response categories are not the same for males and females. O H: The proportions falling into the two response categories are not the same for males and females. H: The proportions falling into the two response categories are the same for males and females. O H,: The proportions falling into the two response categories are 0.5 for both males and females. H: The proportions falling into the two response categories are not 0.5 for both males and females. O H: The proportions falling into the two response categories are not 0.5 for both males and females. H: The proportions falling into the two response categories are 0.5 for both males and females. Find the test statistic and P-value. (Use technology. Round your test statistic to three decimal places and your P-value to four decimal places.) P-value =

Holt Mcdougal Larson Pre-algebra: Student Edition 2012
1st Edition
ISBN:9780547587776
Author:HOLT MCDOUGAL
Publisher:HOLT MCDOUGAL
Chapter11: Data Analysis And Probability
Section: Chapter Questions
Problem 8CR

Related questions
Topic Video
Question
100%
please help!
Transcribed Image Text:A 14.2 Test Homogeneity and Indpi x
b The data summarized in the acco x G screenshot screen on windows - X +
A webassign.net/web/Student/Assignment-Responses/last?dep=25472461
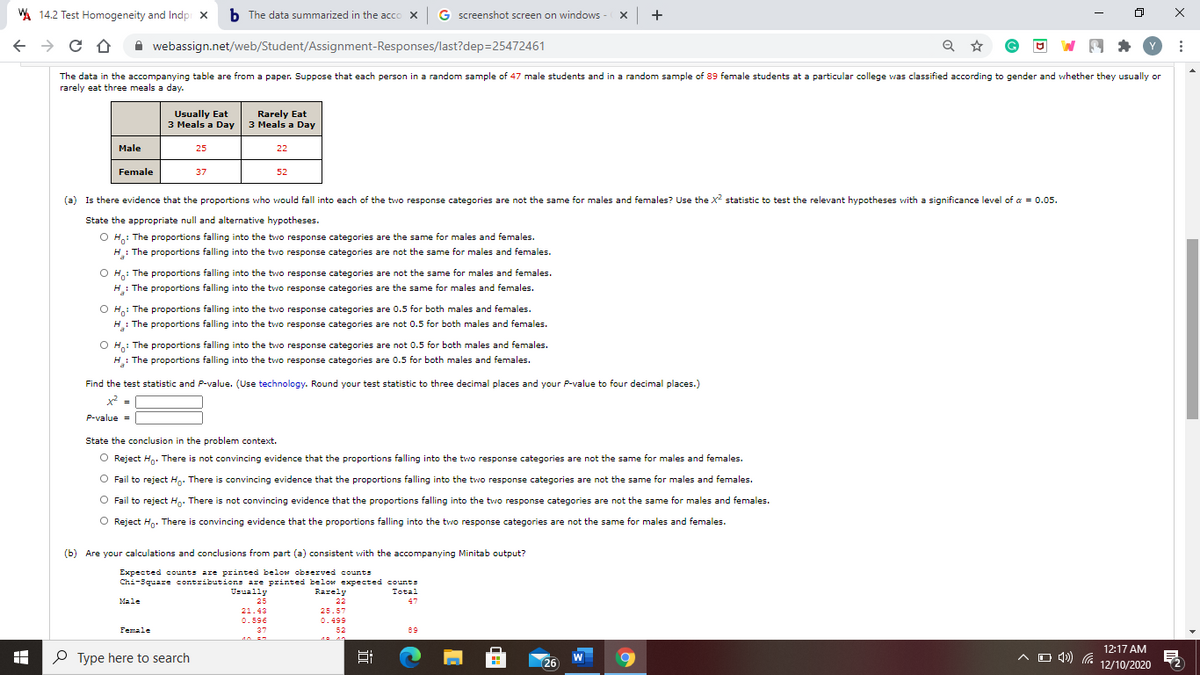
The data in the accompanying table are from a paper. Suppose that each person in a random sample of 47 male students and in a random sample of 89 female students at a particular college was classified according to gender and whether they usually or
rarely eat three meals a day.
Usually Eat
3 Meals a Day
Rarely Eat
3 Meals a Day
Male
25
22
Female
37
52
(a) Is there evidence that the proportions who would fall into each of the two response categories are not the same for males and females? Use the x? statistic to test the relevant hypotheses with a significance level of a = 0.05.
State the appropriate null and alternative hypotheses.
O H,: The proportions falling into the two response categories are the same for males and females.
H: The proportions falling into the two response categories are not the same for males and females.
O H: The proportions falling into the two response categories are not the same for males and females.
H: The proportions falling into the two response categories are the same for males and females.
O H: The proportions falling into the two response categories are 0.5 for both males and females.
H: The proportions falling into the two response categories are not 0.5 for both males and females.
: The proportions falling into the two response categories are not 0.5 for both males and females.
Ho:
H: The proportions falling into the two response categories are 0.5 for both males and females.
Find the test statistic and P-value. (Use technology. Round your test statistic to three decimal places and your P-value to four decimal places.)
x =
P-value =
State the conclusion in the problem context.
O Reject Hn. There is not convincing evidence that the proportions falling into the two response categories are not the same for males and females.
O Fail to reject Hg. There is convincing evidence that the proportions falling into the two response categories are not the same for males and females.
Fail to reject H,. There is not convincing evidence that the proportions falling into the two response categories are not the same for males and females.
O Reject H. There is convincing evidence that the proportions falling into the two response categories are not the same for males and females.
(b) Are your calculations and conclusions from part (a) consistent with the accompanying Minitab output?
Expected counts are printed below observed counts
Chi-3quare contributions are printed below expected count=
Usually
Rarely
Total
Male
25
22
47
21.43
25.57
0.596
0.499
Female
37
52
89
O Type here to search
12:17 AM
A O 49) (a 12/10/2020
W
26
近
Transcribed Image Text:A 14.2 Test Homogeneity and Indpi x
b The data summarized in the acco x G screenshot screen on windows - X +
A webassign.net/web/Student/Assignment-Responses/last?dep=25472461
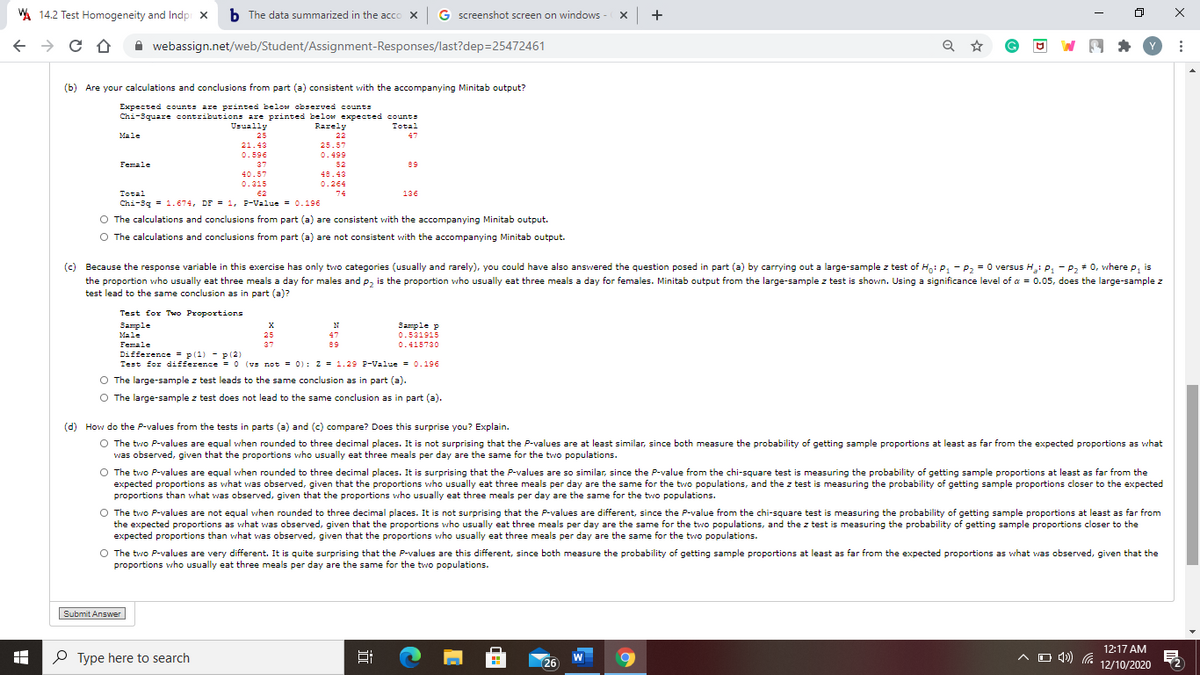
(b) Are your calculations and conclusions from part (a) consistent with the accompanying Minitab output?
Expected counts are printed below observed counts
Chi-3quare contributions are printed below expected counts
Usually
Rarely
Total
Male
25
22
47
21.43
25.57
0.596
0.499
Female
37
52
89
48.43
40.57
0.315
0.264
Total
62
74
136
Chi-3g = 1.674, DF = 1, F-Value = 0.196
O The calculations and conclusions from part (a) are consistent with the accompanying Minitab output.
O The calculations and conclusions from part (a) are not consistent with the accompanying Minitab output.
(c) Because the response variable in this exercise has only two categories (usually and rarely), you could have also answered the question posed in part (a) by carrying out a large-sample z test of H: P, - P, = 0 versus H: P, - P, + 0, where p, is
the proportion who usually eat three meals a day for males and p, is the proportion who usually eat three meals a day for females. Minitab output from the large-sample z test is shown. Using a significance level of a = 0.05, does the large-sample z
test lead to the same conclusion as in part (a)?
Test for Two Proportions
Sample
Sample p
Male
25
47
0.531915
Female
37
89
0.415730
Difference = p(1) - p (2)
Test for difference = O (vs not = 0): z = 1.29 P-Value = 0.196
O The large-sample z test leads to the same conclusion as in part (a).
O The large-sample z test does not lead to the same conclusion as in part (a).
(d) How do the P-values from the tests in parts (a) and (c) compare? Does this surprise you? Explain.
O The two P-values are equal when rounded to three decimal places. It is not surprising that the P-values are at least similar, since both measure the probability of getting sample proportions at least as far from the expected proportions as what
was observed, given that the proportions who usually eat three meals per day are the same for the two populations.
O The two P-values are equal when rounded to three decimal places. It is surprising that the P-values are so similar, since the P-value from the chi-square test is measuring the probability of getting sample proportions at least as far from the
expected proportions as what was observed, given that the proportions who usually eat three meals per day are the same for the two populations, and the z test is measuring the probability of getting sample proportions closer to the expected
proportions than what was observed, given that the proportions who usually eat three meals per day are the same for the two populations.
O The two P-values are not equal when rounded to three decimal places. It is not surprising that the P-values are different, since the P-value from the chi-square test is measuring the probability of getting sample proportions at least as far from
the expected proportions as what was observed, given that the proportions who usually eat three meals per day are the same for the two populations, and the z test is measuring the probability of getting sample proportions closer to the
expected proportions than what was observed, given that the proportions who usually eat three meals per day are the same for the two populations.
O The two P-values are very different. It is quite surprising that the P-values are this different, since both measure the probability of getting sample proportions at least as far from the expected proportions as what was observed, given that the
proportions who usually eat three meals per day are the same for the two populations.
Submit Answer
P Type here to search
12:17 AM
A O 49) (a 12/10/2020
W
26
Expert Solution
This question has been solved!
Explore an expertly crafted, step-by-step solution for a thorough understanding of key concepts.

This is a popular solution!

Trending now
This is a popular solution!

Step by step
Solved in 3 steps with 1 images

Knowledge Booster


Learn more about
Need a deep-dive on the concept behind this application? Look no further. Learn more about this topic, statistics and related others by exploring similar questions and additional content below.Recommended textbooks for you
Holt Mcdougal Larson Pre-algebra: Student Edition…
Algebra
ISBN:
9780547587776
Author:
HOLT MCDOUGAL
Publisher:
HOLT MCDOUGAL

Algebra & Trigonometry with Analytic Geometry
Algebra
ISBN:
9781133382119
Author:
Swokowski
Publisher:
Cengage

Glencoe Algebra 1, Student Edition, 9780079039897…
Algebra
ISBN:
9780079039897
Author:
Carter
Publisher:
McGraw Hill
Holt Mcdougal Larson Pre-algebra: Student Edition…
Algebra
ISBN:
9780547587776
Author:
HOLT MCDOUGAL
Publisher:
HOLT MCDOUGAL
Algebra & Trigonometry with Analytic Geometry
Algebra
ISBN:
9781133382119
Author:
Swokowski
Publisher:
Cengage
Glencoe Algebra 1, Student Edition, 9780079039897…
Algebra
ISBN:
9780079039897
Author:
Carter
Publisher:
McGraw Hill