The data in this question provides list of new cases and new death related to COVID-19 in London for the month of June 2020. a. Analysis of New cases: i. Use Excel to construct a frequency table, frequency histogram, and ogive for the new cases use the bin values provided. What can you observe about the data from the frequency distribution? How would you characterize the shape of the distribution? ii. Use Excel to find mean, median, mode, range, and standard deviation for the new Cases of COVID-19 in London for the Month of June. iii. Based on part i and ii, describe the distribution of new case


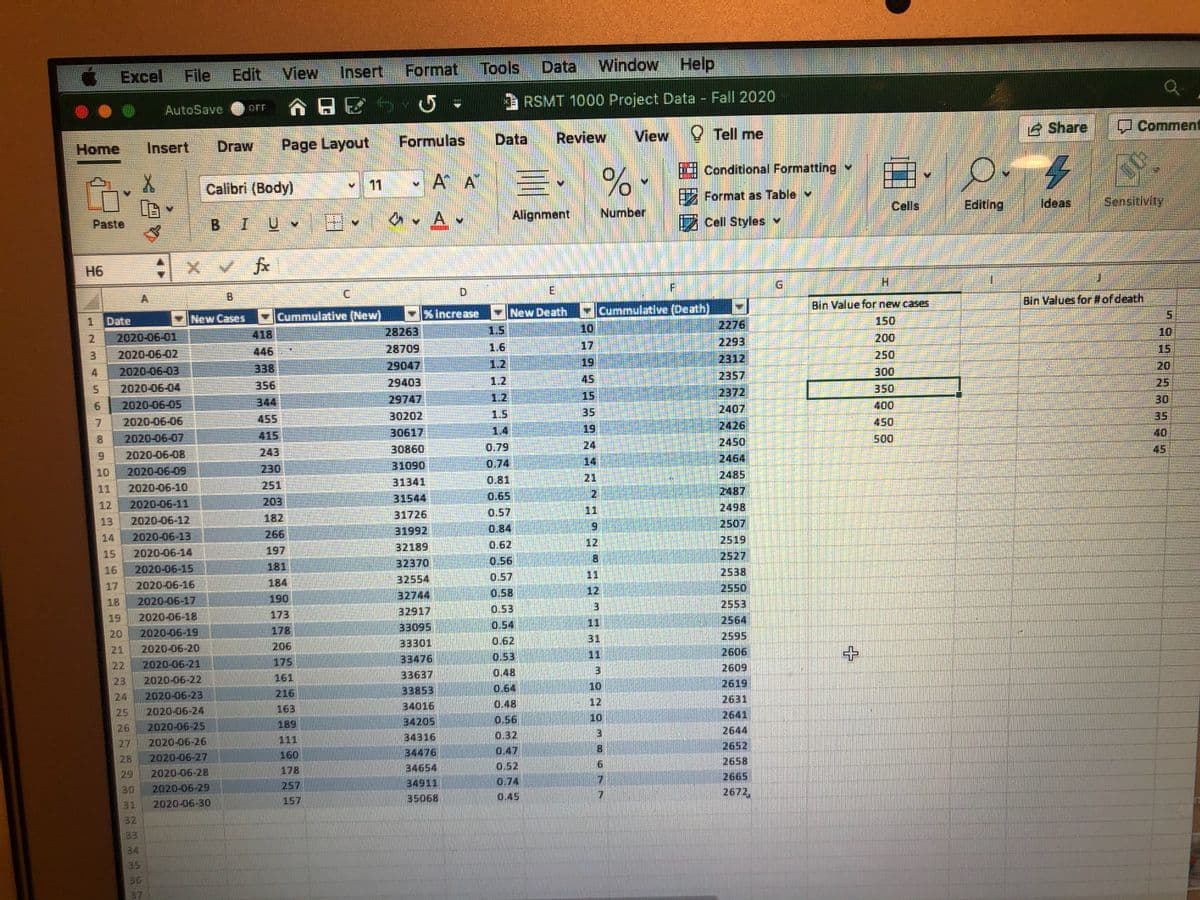
The data in this question provides list of new cases and new death related to COVID-19 in London for the month of June 2020.
a. Analysis of New cases:
i. Use Excel to construct a frequency table, frequency histogram, and ogive for the new cases use the bin values provided. What can you observe about the data from the frequency distribution? How would you characterize the shape of the distribution?
ii. Use Excel to find mean, median,
iii. Based on part i and ii, describe the distribution of new cases in June 2020?
b. Analysis of new death count:
i. Use Excel to construct a frequency table, frequency histogram, and ogive for the death count use the bin values provided. What can you observe about the data from the frequency distribution? How would you characterize the shape of the distribution?
ii. Use Excel to find mean, median, mode, range, and standard deviation for the death count of COVID-19 in London for the Month of June


Trending now
This is a popular solution!

Step by step
Solved in 3 steps with 2 images


