The data is given as follow. Excel File: data14-17.xlsx 13 20 Yi 18 26 23 The estimated regression equation for these data is ŷ = 7.6 + .9x . Compute SSE, SST, and SSR (to 1 decimal). SSE SST SSR What percentage of the total sum of squares can be accounted for by the estimated regression equation (to 1 decimal)? What is the value of the sample correlation coefficient (to 3 decimals)?
The data is given as follow. Excel File: data14-17.xlsx 13 20 Yi 18 26 23 The estimated regression equation for these data is ŷ = 7.6 + .9x . Compute SSE, SST, and SSR (to 1 decimal). SSE SST SSR What percentage of the total sum of squares can be accounted for by the estimated regression equation (to 1 decimal)? What is the value of the sample correlation coefficient (to 3 decimals)?

Chapter4: Linear Functions
Section: Chapter Questions
Problem 41RE: For the following exercises, consider the data in Table 5, which shows the percent of unemployed in...

Related questions
Question
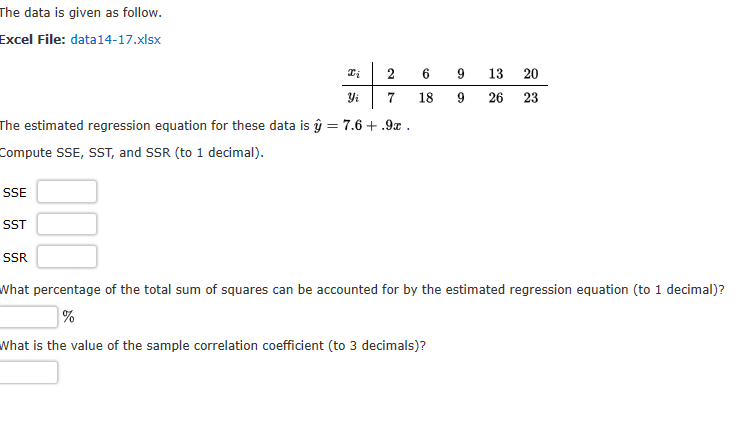
Transcribed Image Text:The data is given as follow.
Excel File: data14-17.xlsx
13 20
Yi
18
26 23
The estimated regression equation for these data is ŷ = 7.6 + .9x .
Compute SSE, SST, and SSR (to 1 decimal).
SSE
SST
SSR
What percentage of the total sum of squares can be accounted for by the estimated regression equation (to 1 decimal)?
What is the value of the sample correlation coefficient (to 3 decimals)?
Expert Solution
This question has been solved!
Explore an expertly crafted, step-by-step solution for a thorough understanding of key concepts.

This is a popular solution!

Trending now
This is a popular solution!

Step by step
Solved in 3 steps with 3 images

Recommended textbooks for you

Glencoe Algebra 1, Student Edition, 9780079039897…
Algebra
ISBN:
9780079039897
Author:
Carter
Publisher:
McGraw Hill

Functions and Change: A Modeling Approach to Coll…
Algebra
ISBN:
9781337111348
Author:
Bruce Crauder, Benny Evans, Alan Noell
Publisher:
Cengage Learning
Glencoe Algebra 1, Student Edition, 9780079039897…
Algebra
ISBN:
9780079039897
Author:
Carter
Publisher:
McGraw Hill
Functions and Change: A Modeling Approach to Coll…
Algebra
ISBN:
9781337111348
Author:
Bruce Crauder, Benny Evans, Alan Noell
Publisher:
Cengage Learning