The data shown below represent the age (in weeks) at which babies first crawl, based on a survey of 12 mothers. Complete parts (a) through (c) below. 52 30 44 47 37 56 26 39 Click here to view the table of critical correlation coefficient values for normal probability_plots. Click here to view page 1 of the standard normal distribution table. Click here to view page 2 of the standard normal distribution table. Click here to view the table of critical t-values. 52 54 Since the correlation between the expected z-scores and the observed data, the critical value it reasonable to conclude that the data come from a population that is normally distributed. (Round to three decimal places as needed.) (c) Construct and interpret a 95% confidence interval for the mean age at which a baby first crawls. Select the correct choice below and fill in the answer boxes to complete your choice. (Round to one decimal place as needed. Use ascending order.) A. There is a 95% probability that the mean age at which a baby first crawls is between weeks and weeks. B. We are 95% confident that the mean age at which a baby first crawls is between weeks and weeks.
The data shown below represent the age (in weeks) at which babies first crawl, based on a survey of 12 mothers. Complete parts (a) through (c) below. 52 30 44 47 37 56 26 39 Click here to view the table of critical correlation coefficient values for normal probability_plots. Click here to view page 1 of the standard normal distribution table. Click here to view page 2 of the standard normal distribution table. Click here to view the table of critical t-values. 52 54 Since the correlation between the expected z-scores and the observed data, the critical value it reasonable to conclude that the data come from a population that is normally distributed. (Round to three decimal places as needed.) (c) Construct and interpret a 95% confidence interval for the mean age at which a baby first crawls. Select the correct choice below and fill in the answer boxes to complete your choice. (Round to one decimal place as needed. Use ascending order.) A. There is a 95% probability that the mean age at which a baby first crawls is between weeks and weeks. B. We are 95% confident that the mean age at which a baby first crawls is between weeks and weeks.

Glencoe Algebra 1, Student Edition, 9780079039897, 0079039898, 2018
18th Edition
ISBN:9780079039897
Author:Carter
Publisher:Carter
Chapter10: Statistics
Section: Chapter Questions
Problem 25SGR

Related questions
Question
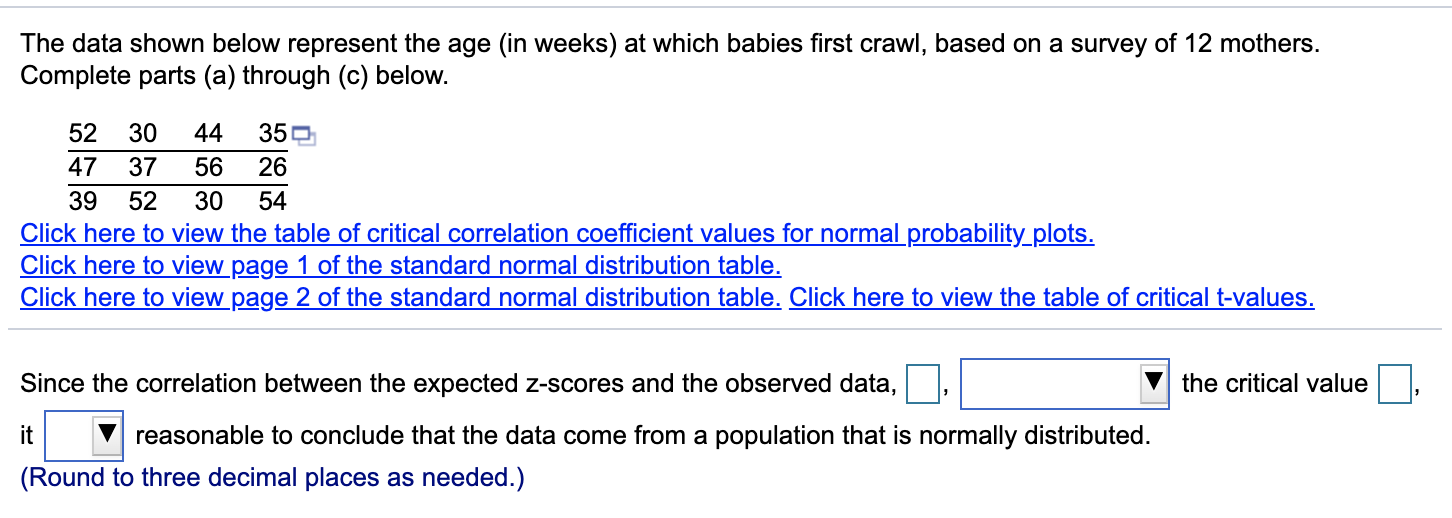
Transcribed Image Text:The data shown below represent the age (in weeks) at which babies first crawl, based on a survey of 12 mothers.
Complete parts (a) through (c) below.
52
30
44
47
37
56
26
39
Click here to view the table of critical correlation coefficient values for normal probability_plots.
Click here to view page 1 of the standard normal distribution table.
Click here to view page 2 of the standard normal distribution table. Click here to view the table of critical t-values.
52
54
Since the correlation between the expected z-scores and the observed data,
the critical value
it
reasonable to conclude that the data come from a population that is normally distributed.
(Round to three decimal places as needed.)
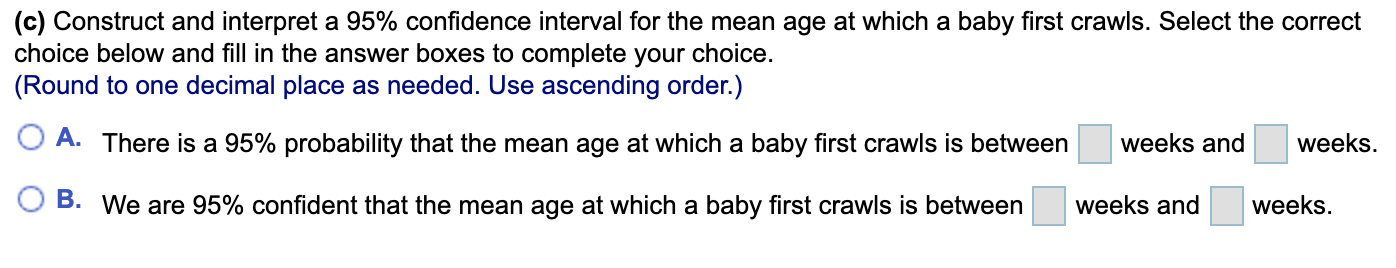
Transcribed Image Text:(c) Construct and interpret a 95% confidence interval for the mean age at which a baby first crawls. Select the correct
choice below and fill in the answer boxes to complete your choice.
(Round to one decimal place as needed. Use ascending order.)
A. There is a 95% probability that the mean age at which a baby first crawls is between
weeks and
weeks.
B. We are 95% confident that the mean age at which a baby first crawls is between
weeks and
weeks.
Expert Solution
This question has been solved!
Explore an expertly crafted, step-by-step solution for a thorough understanding of key concepts.

This is a popular solution!

Trending now
This is a popular solution!

Step by step
Solved in 6 steps with 4 images

Recommended textbooks for you
Glencoe Algebra 1, Student Edition, 9780079039897…
Algebra
ISBN:
9780079039897
Author:
Carter
Publisher:
McGraw Hill
Glencoe Algebra 1, Student Edition, 9780079039897…
Algebra
ISBN:
9780079039897
Author:
Carter
Publisher:
McGraw Hill