the dexes calculated for (2019-2020) and the Regression Model parameters are given as follows: Seasons SI Regression Model Q1 0.654 b0=12.25 Q2 1.982 bl=-0.27 0.762 Q3 Q4 The Adjusted Forecast for Q4- 2021 is: 1.596 diusted 8011 506=14 38
the dexes calculated for (2019-2020) and the Regression Model parameters are given as follows: Seasons SI Regression Model Q1 0.654 b0=12.25 Q2 1.982 bl=-0.27 0.762 Q3 Q4 The Adjusted Forecast for Q4- 2021 is: 1.596 diusted 8011 506=14 38

MATLAB: An Introduction with Applications
6th Edition
ISBN:9781119256830
Author:Amos Gilat
Publisher:Amos Gilat
Chapter1: Starting With Matlab
Section: Chapter Questions
Problem 1P

Related questions
Question
Transcribed Image Text:Parga
syle a
Sertity
Voce
Idor Reue fies
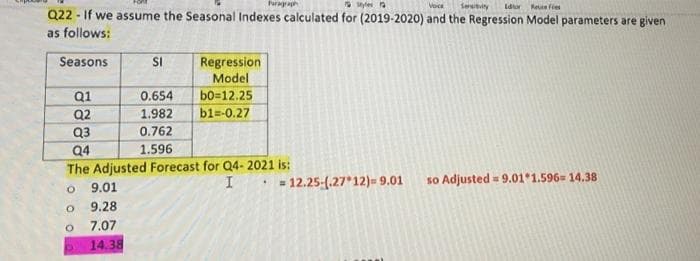
Q22 - If we assume the Seasonal Indexes calculated for (2019-2020) and the Regression Model parameters are given
as follows:
Seasons
SI
Regression
Model
b0=12.25
bl=-0.27
Q1
Q2
0.654
1.982
Q3
0.762
Q4
1.596
The Adjusted Forecast for Q4- 2021 is:
= 12.25-(.27*12)- 9.01
so Adjusted = 9.01*1.596= 14.38
9.01
9.28
O.
7.07
14.38
Expert Solution
This question has been solved!
Explore an expertly crafted, step-by-step solution for a thorough understanding of key concepts.

Step by step
Solved in 2 steps with 1 images

Recommended textbooks for you
MATLAB: An Introduction with Applications
Statistics
ISBN:
9781119256830
Author:
Amos Gilat
Publisher:
John Wiley & Sons Inc

Probability and Statistics for Engineering and th…
Statistics
ISBN:
9781305251809
Author:
Jay L. Devore
Publisher:
Cengage Learning

Statistics for The Behavioral Sciences (MindTap C…
Statistics
ISBN:
9781305504912
Author:
Frederick J Gravetter, Larry B. Wallnau
Publisher:
Cengage Learning
MATLAB: An Introduction with Applications
Statistics
ISBN:
9781119256830
Author:
Amos Gilat
Publisher:
John Wiley & Sons Inc
Probability and Statistics for Engineering and th…
Statistics
ISBN:
9781305251809
Author:
Jay L. Devore
Publisher:
Cengage Learning
Statistics for The Behavioral Sciences (MindTap C…
Statistics
ISBN:
9781305504912
Author:
Frederick J Gravetter, Larry B. Wallnau
Publisher:
Cengage Learning

Elementary Statistics: Picturing the World (7th E…
Statistics
ISBN:
9780134683416
Author:
Ron Larson, Betsy Farber
Publisher:
PEARSON

The Basic Practice of Statistics
Statistics
ISBN:
9781319042578
Author:
David S. Moore, William I. Notz, Michael A. Fligner
Publisher:
W. H. Freeman

Introduction to the Practice of Statistics
Statistics
ISBN:
9781319013387
Author:
David S. Moore, George P. McCabe, Bruce A. Craig
Publisher:
W. H. Freeman