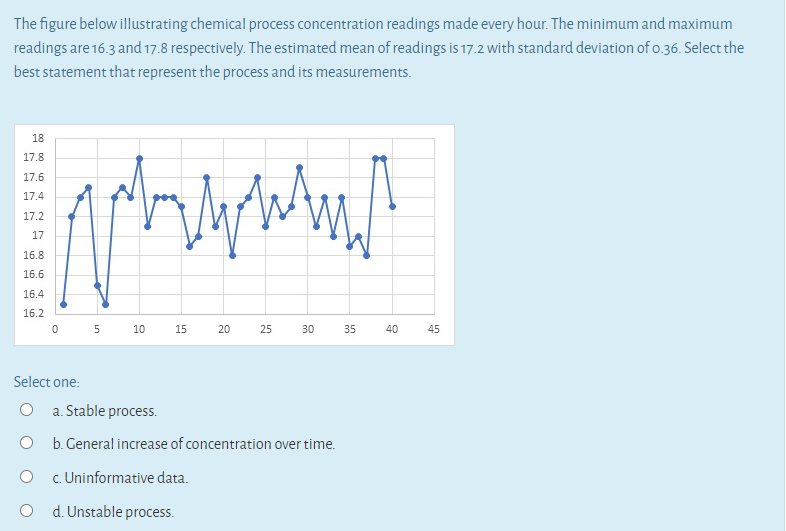
The figure below illustrating chemical process concentration readings made every hour. The minimum and maximum readings are 16.3 and 17.8 respectively. The estimated mean of readings is 17.2 with standard deviation of o.36. Select the best statement that represent the process and its measurements.
The figure below illustrating chemical process concentration readings made every hour. The minimum and maximum readings are 16.3 and 17.8 respectively. The estimated mean of readings is 17.2 with standard deviation of o.36. Select the best statement that represent the process and its measurements.

Glencoe Algebra 1, Student Edition, 9780079039897, 0079039898, 2018
18th Edition
ISBN:9780079039897
Author:Carter
Publisher:Carter
Chapter10: Statistics
Section10.5: Comparing Sets Of Data
Problem 14PPS

Related questions
Topic Video
Question
Transcribed Image Text:The figure below illustrating chemical process concentration readings made every hour. The minimum and maximum
readings are 16.3 and 17.8 respectively. The estimated mean of readings is 17.2 with standard deviation of o.36. Select the
best statement that represent the process and its measurements.
Expert Solution
This question has been solved!
Explore an expertly crafted, step-by-step solution for a thorough understanding of key concepts.

Step by step
Solved in 2 steps

Knowledge Booster


Learn more about
Need a deep-dive on the concept behind this application? Look no further. Learn more about this topic, probability and related others by exploring similar questions and additional content below.Recommended textbooks for you
Glencoe Algebra 1, Student Edition, 9780079039897…
Algebra
ISBN:
9780079039897
Author:
Carter
Publisher:
McGraw Hill

Big Ideas Math A Bridge To Success Algebra 1: Stu…
Algebra
ISBN:
9781680331141
Author:
HOUGHTON MIFFLIN HARCOURT
Publisher:
Houghton Mifflin Harcourt
Glencoe Algebra 1, Student Edition, 9780079039897…
Algebra
ISBN:
9780079039897
Author:
Carter
Publisher:
McGraw Hill
Big Ideas Math A Bridge To Success Algebra 1: Stu…
Algebra
ISBN:
9781680331141
Author:
HOUGHTON MIFFLIN HARCOURT
Publisher:
Houghton Mifflin Harcourt