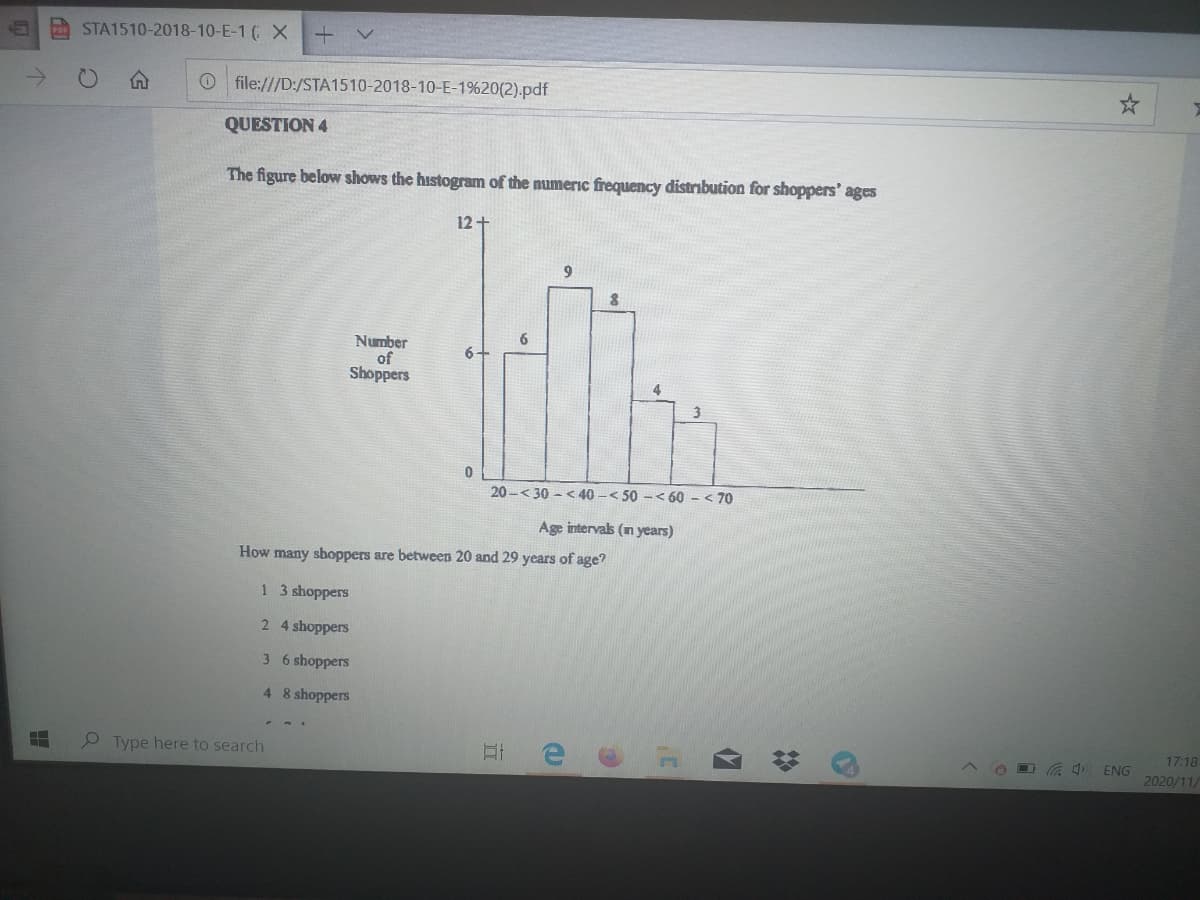
The figure below shows the histogram of the numeric frequency distribution for shoppers' ages 12+ 9. 6. Number of Shoppers 3 20 -< 30 - < 40 -< 50 -< 60 - < 70 Age intervals (n years) How many shoppers are between 20 and 29 years of age? shoppers 2 4 shoppers 3 6 shoppers 4 8 shoppers


Q: A. Should the researcher conclude that there is a significant relation between birth order and…
A: A. The test is that there is a significant relation between birth order and personality or not. The…
Q: c. Organize the data into a relative frequency table. Use the following intervals: 119.5 - 124.5,…
A: Solution-: We find relative frequency histogram:
Q: Find the approximate mean for the grouped frequency distribution. Use the class midpoint to…
A:
Q: A researcher for the EPA mneasured the amount of arsenic in the water near a sewag treatment plant.…
A: To find the number of measurements of less than 60 ppb we have to add all the frequencies below 60.…
Q: The following frequency distribution analyzes the scores on a math test. The class boundaries of…
A: The frequency distribution is: Scores Number of students 40 – 49 6 50 – 59 5…
Q: Find the missing frequency in the following distribution if N is 100 and median is 30. Marks No. of…
A:
Q: The table below shows the frequency distribution for the ages of women who became mothers during one…
A: Solution : a. C b. Yes
Q: 5. The frequency distribution shown in the figure lists the annual salaries of the managers at…
A: 5. Procedure to construct histogram: The x-axis represents the Salaries. The y-axis represents the…
Q: Cookies Using the same frequency distribution from Exercise 1, how many cookies are included?
A: Obtain the number of cookies involved in the summary is given below:
Q: A professor had students keep track of their social interactions for a week. The number of social…
A: Given data,
Q: The national distribution of fatal work injuries in a country is shown in the table to the right…
A: To find the critical value, degree of freedom is required to compute and degree of freedom is given…
Q: he following table gives the frequency distribution of the head circumference (in cm) for a sample…
A: Solution The given data is a grouped data.
Q: 8. The following frequency distribution table is for 50 students who took a competency test. The…
A: Frequency Histogram:
Q: The following frequency distribution analyzes the scores on a math test. Find the class boundaries…
A: Given :- scores number of students 50-59 2 60-69 4 70-79 6 80-89 15 90-99 5 we…
Q: The table below shows a frequency distribution of the lifetimes of electronic tubes produced at a…
A: Given,
Q: The frequency distribution shown is constructed incorrectly. Class Frequency 129-133 134-138 9.…
A: here in this frequency distribution problem there is only one mistake A class of 154-158 is…
Q: An incomplete frequency distribution is given as follows : Variable Frequency Variable Frequency…
A: Given that: We have to find the missing frequencies :
Q: The times taken (to the nearest second) by 108 athletes to run a race is given in the table below:…
A: “Since you have posted a question with multiple sub-parts, we will solve first three subparts for…
Q: The table below shows a frequency distribution of the lifetimes of electronic tubes produced at a…
A: Given : Lifetime (hours) Number of Electronic tubes Percentage 300-399 14 3.5 400-499…
Q: Approximate the mean of the frequency distribution for the ages of the residents of a town. The…
A: From the provided information, The table is as follow: Age Mid point (x) Frequency (f) fx…
Q: The given below is a cumulative frequency histogram of scores on a standardized coding final exam at…
A: Dear student as per guidelines we answer the first question only when multiple different question…
Q: Consider the folilowing frequency table representing the scores on a test. Scores on a Test Class…
A:
Q: The following table gives the frequency distribution of prices for a sample of 30 college textbooks.…
A: From the given data: Price Midpoint (x) f xf 20-30 25 4 100 30-40 35 7 245 40-50 45 13 585…
Q: Construct a frequency table. Consider the scores of 50 Grade 12 students in Physics exam.…
A: Introduction - Cumulative frequency - Less than cumulative frequency is obtained by adding…
Q: The following table gives the frequency distribution of the daily commute times (in minutes) from…
A: Given frequency distribution table is Daily Commuting Time (mins) Classes Number of Employees…
Q: 2. A psychologist estimates the I.Q of 28 students. The values are as follows: 103, 86, 94, 97, 100,…
A:
Q: In constructing a frequency distribution for population, the number of classes depends on OA. None…
A: Formula Used: Number of classes = 1 + 1.33Log(N) Where N is population size.
Q: The times taken (to the nearest second) by 108 athletes to run a race is given in the table below:…
A: “Since you have posted a question with multiple sub-parts, we will solve first three subparts for…
Q: The national distribution of fatal work injuries in a country is shown in the table to the right…
A: a) The null hypothesis H0 is, H0: The distribution of fatal work in the west is same as the national…
Q: Approximate the mean of the frequency distribution for the ages of the residents The approximate…
A: It is an important part of statistics . It is widely used in all forms of statistical applications .
Q: Refer to the slot depth in Table 1 below. After the machine was repaired, a sample of three new…
A: From the given information we have Time 6:30 7:00 7:30 8:00 8:30 9:00 9:30 10:00 1 214 218…
Q: com is studying the lead time (elapsed time between when an order is placed and when it is filled)…
A: Given, Range Frequency 0 to 5 12 5 to 10 14 10 to 15 24 15 to 20 16 20 to 25 14…
Q: Marks obtained by 30 students in History of a Test Examination 2021 of some school are as follows:…
A: Given Data :
Q: The following frequency distribution shows the number of crimes committed in a sample of 100 urban…
A: Procedure to construct the Histogram: EXCEL procedure to plot Histogram: Go to EXCEL Go to…
Q: The frequency distribution given below is constructed from the ages of 200 people of 40 years old or…
A: Relative Frequency=R Frequency=F Total Frequency=T=200 Relative Frequency=(Frequency/Total…
Q: Data: Below are the number of patients who visited the Out-patient Department of the Baguio General…
A: Given data:…
Q: The table below shows the scores of a group of students on a 10- Test Score Frequency 3. 4 4 10 The…
A:
Q: The national distribution of fatal work injuries in a country is shown in the table to the right…
A: The given data is about chi-square test for goodness-of-fit. The total number of fatal work injuries…
Q: Use the relative frequency distribution in the table below to determine the following. (See Example…
A: The relative frequency table is given as follows: Download time (in seconds) Percent of…
Q: The estimated distribution (in millions) of the population by age in a certain country for the year…
A: Given:
Q: The marks scored by 50 students in an examina- tion paper are given below: 30 45 48 55 39 25 31 12…
A: From the provided information, Number of students (N) = 50
Q: Lifetime Number of (hours) Electronic Tubes 14 46 300-399 400-499 500-599 58 600-699 76 700-799 68…
A: Given,
Q: b) Marks obtained by 89 students in sociology are given below: 2+2+2=6 Marks No. of students 0-6…
A: The histogram is
Q: arsnSevar 32. Find the Geometric mean from the following frequency distribution of the marks: Marks…
A: To calculate: The geometric mean from the frequency distribution
Q: The data given below is for 327 randomly selected 10-minute intervals, where the number of people…
A:
Q: Data was collected for 151 randomly selected 10 minute intervals. For each ten-minute interval, the…
A: According to the provided information, Number of Guests Frequency 60 – 64 11 65 – 69…
Q: The following frequency distribution analyzes the scores on a math test. Find the class midpoint of…
A: The formula for midpoint of a class is as follows: Mid point=Lower limit+Upper limit2
Q: USING 8 AS THE LOWER LIMIT OF THE CLASS AND WITH A WIDTH OF 1 UNIT, CONVERT IT TO FREQUENCY…
A: We are asked to convert the following data into a frequency distribution, using 8.0 as the lower…
Q: Below is the frequency distribution table of the Mathematics test scores of 50 students. Is the…
A: Solution-: We have following table: Scores Frequency 46-50 4 41-45 8 36-40 11 31-35 9…
Q: The grouped frequency distribution for the weight gain (in pounds) for 26 pregnant women is…
A:


Trending now
This is a popular solution!

Step by step
Solved in 2 steps


- Fingerprint analysis and blood grouping are features that do not change through the lifetime of an individual. Fingerprint features appear early in the development of a fetus, and blood types are determined by genetics. Therefore, each is considered an effective tool for identification of individuals. These characteristics are also of interest in the discipline of biological anthropology—a scientific discipline concerned with the biological and behavioral aspects of human beings. The relationship between these characteristics was the subject of a study conducted by biological anthropologists with a simple random sample of male students from a certain region with a large student population. Fingerprint patterns are generally classified as loops, whorls, and arches. The four principal blood types are designated as A, B, AB, and O. The table shows the distribution of fingerprint patterns and blood types for the sample. Expected counts are listed in parentheses. The anthropologists…Fingerprint analysis and blood grouping are features that do not change through the lifetime of an individual. Fingerprint features appear early in the development of a fetus, and blood types are determined by genetics. Therefore, each is considered an effective tool for identification of individuals. These characteristics are also of interest in the discipline of biological anthropology—a scientific discipline concerned with the biological and behavioral aspects of human beings. The relationship between these characteristics was the subject of a study conducted by biological anthropologists with a simple random sample of male students from a certain region with a large student population. Fingerprint patterns are generally classified as loops, whorls, and arches. The four principal blood types are designated as A, B, AB, and O. The table shows the distribution of fingerprint patterns and blood types for the sample. Expected counts are listed in parentheses. The anthropologists…The first, second, and third quartile of age at diagnosis of breast cancer among Asian Americans are 42 years, 54 years, and 62 years, respectively. Suppose age at diagnosis of breast cancer has a normal distribution in the population of Asian Americans. The mode of the age at diagnosis of breast cancer among Asian Americans is _____
- 1)After training, six workers underwent a test and later measured the productivity of each of them. From the re- results presented in the table beside, calculate the correlation coefficient between the test score and the productivity.That animal species produce more offspring when their supply of food goes up isn’t surprising. That some animals appear able to anticipate unusual food abundance is more surprising. Red squirrels eat seeds from pine cones, a food source that occasionally has very large crops (called seed masting). What is striking is that the offspring are conceived in the spring, before the cones mature in the fall to feed the new young squirrels through the winter. Here are data on an index of the abundance of pine cones and average number of offspring per female over 16 years: Pine Index x 0 2.02 0.25 3.22 4.68 0.31 3.37 3.09 2.44 4.81 1.88 0.31 1.61 1.88 0.91 1.04 Offspring y 1.49 1.1 1.29 2.71 4.07 1.29 3.36 2.41 1.97 3.41 1.49 2.02 3.34 2.41 2.15 2.12 (a) Describe the relation between the variable x (Pine index) and the variable y (offspring) using the correlation factor r. Explain what r tells us about the relation. (b) Find the expected y value for a year when the Pine…a. Correlation coefficient between hoursspend on using mobile per day and hours spend on readingbooks per day.
- A researcher is interested in seeing what effect a particular type of drug has on an intelligence test, depending on the time of day that the pill is administered. The researcher computes a two-way ANOVA and plots the resulting cell means on the graph at right. Assuming that any obvious differences are statistically significant Is there a main effect for type of pill? Is there a main effect for time of day? Is there an interaction? 4. Describe the findings of the study in everyday termsWater availability is of prime importance in the life cycle of most reptiles. To determine the rate of evaporative water loss of a certain species of lizard at a particular desert site, 34 such lizards were randomly collected, weighed and placed under the appropriate experimental conditions. After 24 hours, each lizard was removed, weighed, and its total water loss was calculated by subtracting its body weight after treatment from its initial body weight. Previous studies have shown that the relative frequency distribution of water loss for this species of lizard has a mean of 3.1 grams and a s.d. of 0.8 gram b) What is the probability that x is less than 2.7 grams?Water availability is of prime importance in the life cycle of most reptiles. To determine the rate of evaporative water loss of a certain species of lizard at a particular desert site, 34 such lizards were randomly collected, weighed and placed under the appropriate experimental conditions. After 24 hours, each lizard was removed, weighed, and its total water loss was calculated by subtracting its body weight after treatment from its initial body weight. Previous studies have shown that the relative frequency distribution of water loss for this species of lizard has a mean of 3.1 grams and a s.d. of 0.8 gram. a) What is the approximate sampling distribution of x , the mean water loss of the 34 lizards
- The article “Statistical Modeling of the Time Courseof Tantrum Anger” (Annals of Applied Stats, 2009:1013–1034) discussed how anger intensity in children’s tantrums could be related to tantrumduration as well as behavioral indicators such asshouting, stamping, and pushing or pulling. The followingfrequency distribution was given (and alsothe cor responding histogram):02,2 : 136 22,4: 92 42,11: 71112,20: 26 202,30: 7 302,40: 3Draw the histogram and then comment on any interestingfeatures.Aortic stenosis refers to a narrowing of the aortic valvein the heart. The article “Correlation Analysis ofStenotic Aortic Valve Flow Patterns Using PhaseContrast MRI” (Annals of Biomed. Engr., 2005:878–887) gave the following data on aortic root diameter(cm) and gender for a sample of patients having variousdegrees of aortic stenosis:M: 3.7 3.4 3.7 4.0 3.9 3.8 3.4 3.6 3.1 4.0 3.4 3.8 3.5F: 3.8 2.6 3.2 3.0 4.3 3.5 3.1 3.1 3.2 3.0a. Compare and contrast the diameter observations forthe two genders.b. Calculate a 10% trimmed mean for each of the twosamples, and compare to other measures of center(for the male sample, the interpolation method mentionedin Section 1.3 must be used).Define correlation coefficient and probable error?
