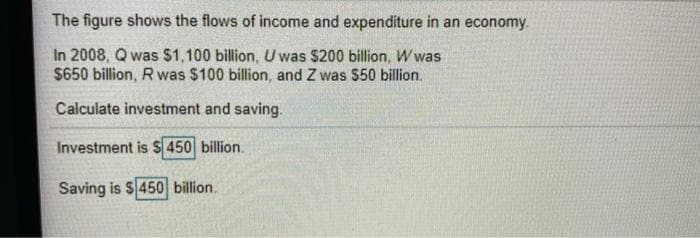
The figure shows the flows of income and expenditure in an economy. In 2008, Q was $1,100 billion, U was $200 billion, W was $650 billion, Rwas $100 billion, and Z was $50 billion. Calculate investment and saving. Investment is S 450 billion. Saving is $450 billion.


Q: 1. Calculate the disposable income from the following table: Flows in the economy of Classica Total…
A: The present value of all finished products and services in the economy is referred to as aggregate…
Q: The table below provides Income and consumption Data in billions of dollars. Answer question below…
A: Here, the given table shows the consumption level at different income levels in an economy.
Q: Q6. Where do new-home sales appear in the circular flow of expenditure and income? Explain how a…
A: The total financial or market value of all finished product and services created within a country's…
Q: Which one of these will be deducted from gross output to determine the net output? a. Total…
A: Net output = Gross output – Intermediate consumption(Depreciation) whereas factor income from…
Q: During recessions which type of spending falls?a. consumption and investmentb. investment but not…
A: Recession is a situation of fall in whole economic activity. In other words, Recession is a business…
Q: 3. If taxes increase, then: a. disposable income decreases b. disposable income increases…
A: Disposable income = Income - Taxes.
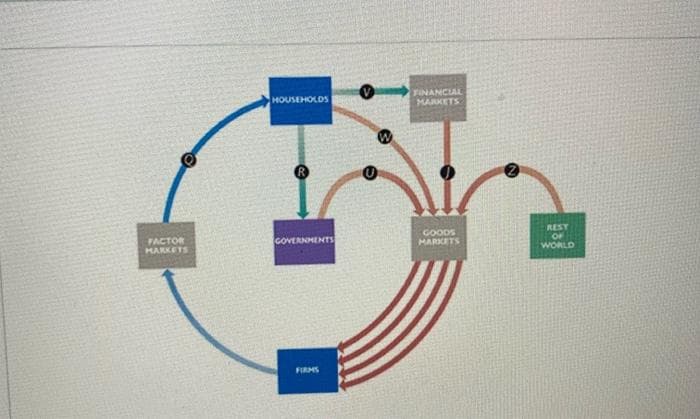
Q: The figure shows the flows of income and expenditure in an economy. FINANCIAL MARKETS In 2008, Q was…
A: Solution -1) We know, Q = U + W + Z + Investments $1200 = $200 + $650 + $80 + Investment $1200 =…
Q: In the below table, C is consumption expenditure, Iis investment, G is government expenditure, and…
A: unplanned inventory is the difference between real output and aggregate demand. and the national…
Q: Suppose a closed economy has national income of $11 million, Investment of $2 million, CPI of 150…
A: A closed economy is not open to trade. National income measures the value of all the goods and…
Q: An Airline spends the following amounts: Employee Salaries 500,000 New Plane 1,500,000 New Engine to…
A: As economies and societies developed, the study of economics got more complicated. Hence, as a…
Q: That part of income which is either consumed or saved by all the households in an economy is called…
A: Savings refer to the part of income set aside to use in the future. Consumption spending refers to…
Q: If consumption expenditures are $1800 million, gross investment is $450 million, imports are $350…
A: Given consumption expenditures(C) = $1800 million, gross investment(I) = $450 million, imports(M)…
Q: If national income is $13 Trillion, Net Exports are -$3.5 Trillion, Investment is $2 Trillion, and…
A: GDP of a country estimates all the transactions within the boundary of the nation. It is considered…
Q: how to find gross investment in the economy? is it correct if i add Net investment to Capital…
A: Investment: The term investment refers to the increase in the stock of capital. Here, capital is…
Q: YAt right is a simplified circular-flow diagram for the economy of Micronia. (Note that there is no…
A: We are going to find the disposable income, Gross domestic product to answer this question.
Q: b. Assume the budget deficit in a closed economy is $2b, GDP is $100b and private savings is $10b,…
A: Investment is a part of GDP. GDP comprises Consumption, Investment, Government expenditure, and Net…
Q: If personal taxes are 400 billion and disposable income is 4,000 billion, then what does personal…
A: Meaning of Disposable Income: The term disposable income also refers to net income or disposable…
Q: Explain how an increase in the interest rate can influence the level of GDP. (in 7 lines maximum). A…
A: Higher interest rate decreases AD because Business investment will decline because it is less…
Q: d. Calculate 2013 government purchases of goods and services and government investment spending. e.…
A: => Government purchases of goods and services and investment spending are $3125.5 = $1245.9 +…
Q: Use the concepts of gross investment and net investment to distinguish between an economy that has a…
A: Gross investment comprises of total investment goods. These are those which replace equipment and…
Q: consider the following hypothetical economy. Consumption makes of 60% of national income,…
A: Given consumption is 60% of national income implies that C=0.6Y, where C is consumption and Y is…
Q: Given the following: consumption = 400, investment = 100, government expenditure = 50 and net export…
A: GDP = Consumption + Investment + Government expenditure + Net export
Q: farmer grows a bushel of wheat and sells it to a Miller for $20.00. The Miller turns the wheat into…
A: Disclaimer: Since you have posted a question with multiple sub-parts, we will solve the first three…
Q: Question One The data below is for the small economy of Christodea in 2015. Consumption: C = 500 +…
A: Hello. Since you have posted multiple parts of the question and not specified which part of the…
Q: Given the following on a closed economy. C = 40 + 0.8Yd C= consumption I= Investment I = 55 – 200 G…
A: A closed economy is the one which does not trade with other economies with respect to goods and…
Q: how consumption, saving and investment relate to national income.
A: National income of a country is generated by considering all the economic activities conducted by…
Q: If consumption expenditures are $1800 million, gross investment is $450 million, imports are $350…
A: In the national income method of calculating GDP, all the expenditures are added, like consumption,…
Q: Given the following on a closed economy. C = 40 + 0.8Yd I= 55 – 200, C= consumption I= Investment G…
A:
Q: QUESTION 7 In reality, AD rarely O decreases; increases at a pace much slower than potential GDP O…
A: Aggregate demand shows the inverse relationship between price and quantity demanded. It is downward…
Q: The figure shows the flows of expenditure and income on Lotus Island. In 2016, R was $7 billion; W…
A: We know that, Total Expenditure- C+I+G+NX Here, C= W, I= J, G=U and NX= Z So, Total Expenditure = W…
Q: the Valuc Personal disposable (net) income ii. GDP Total Savings i. iii. p) Assuming the U.S economy…
A: Considering a closed economy meaning economy is not open to foreign trade. Personal Disposable (net)…
Q: Explain THREE (3) factors that can influence investment in an economy.
A: Investment is the process of adding to the stock of capital assets with the expectation of getting a…
Q: Q.1.8 In the national income accounts: (2) (1) Total spending is always equal to total production…
A: In the national income accounts total spending is always equal to total production and income.
Q: Which component of GDP will increase if disposable income increases
A: The Gross Domestic Product (GDP) measures the market value of all the final goods and services…
Q: What does disposable income measure? the income households have from investment income such as…
A: Depending on the usual specifics of the situation like the purposes of taxes, financial accounting,…
Q: Suppose GDP is $8 trillion, taxes are $1.5 trillion, private savings is $0.5 trillion, and public…
A: GDP means gross domestic product which can be calculated using value added method, income method and…
Q: Given the following on a closed economy. C = 40 + 0.8Y a I= 55 – 200, C= consumption I= Investment G…
A: [As per answering policy, only 1st 3 parts can be answered, so you've to post rest 3 parts in…
Q: Explain some reasons why consumption spending and gross private domestic investment spending are so…
A: GDP (Gross Domestic Product): It refers to the total of market value of all produced final goods and…
Q: We have the following information for an economy. All values are in billion dollars. Output (Income)…
A: The planned aggregate expenditure is the sum of planned consumption expenditure, planned investment…
Q: The aggregate expenditure for a simple economy in 2016 was $9 million. The table below shows…
A: Given: Aggregate expenditure in 2016=$9 million
Q: Given the following on a closed economy. C = 40 + 0.8Yd C= consumption I = 55 – 200r I= Investment G…
A: Since you have posted a question with multiple sub-parts, we will solve the first three sub-parts…
Q: The table shows some of the items in an economy's National Income and Product Accounts. Calculate…
A: Below is the calculation of national income: *National Income = GNP - Depreciation National Income…
Q: ______ Is that type of investment which is not affected by change in the level of output or income
A: According to the given question Investment is basically known as the item of the asset which goal in…
Q: ECONOMICS .In an economy, total savings are $2000 crore and the ratio of Average Propensity to Save…
A: we can calculate the level of income by using APS and APC which are as follow-
Q: If consumption expenditure is $3100 and savings is $1800 Calculate income
A: According to the above mentioned question, we have:- Consumption expenditure = $3100 Savings = $1800…
Q: Complete the following table by using national income accounting identities to calculate private and…
A: Consumption, investment and government expenditure are components of GDP in a closed economy.


Trending now
This is a popular solution!

Step by step
Solved in 2 steps with 2 images


- Mylie’s total utility from singing the same song over andover is 50 utils after one repetition, 90 utils after tworepetitions, 70 utils after three repetitions, 20 utils afterfour repetitions, 250 utils after five repetitions, and 2200utils after six repetitions. Write down her marginal utilityfor each repetition. Once Mylie’s total utility beginsto decrease, does each additional singing of the songhurt more than the previous one or less than the previousone?Consider the market for a single network good and suppose thatconsumers differ in their valuation of both the stand-alone and thenetwork benefits (it can indeed be argued that it is more plausiblethat a user who has a higher value for the stand-alone component of atechnology also assigns more importance to the size of its network.) Tocapture this idea, write the consumer’s utility function for joining thenetwork as U(θ) = θ(a + νne), where a is the stand-alone benefit, ν > 0measures the network effect, neis the expected number of users joiningthe network, and is uniformly distributed on the unit interval.a. What happens if p > a + νne? (Hint: Identify all consumer who buythe good for at price p and a given expected network size ne).b. What is the consumer’s willingness to pay for the nth unit of thegood when ne units are expected to be sold? Is the demand downwardsloping? Does the demand increase with the expected network size?c. Express the fulfilled-expectations demand curve…Praxilla, who lived in ancient Greece, derives utility from reading poems and from eating cucumbers. Praxilla gets 30 units of marginal utility from her first poem 27 units of marginal utility from her second poem 24 units of marginal utility from her third poem, and so on, with marginal utility declining by three units for each additional poem. Praxilla gets six units of marginal utility for each of her next three cucumbers consumed, five units of marginal utility for each of her next three cucumbers consumed, four units of marginal utility for each of the following three cucumbers consumed, and so on, with marginal utility declining by one for every three cucumber consumed. A poem costs three bronze coins hut a cucumber costs only one bronze coin. Praxilla has 18 bronze coins. Sketch Praxillas budget set between poems and cucumbers, placing poems on the vertical axis and cucumbers on the horizontal axis. Start off with the choice of zero poems and 18 cucumbers, and calculate the changes in marginal utility of moving along the budget line to the next choice of one poem and 15 cucumbers. Using this step-by-step process based on marginal utility, create a table and identify Praxillas utility—maximizing choice. Compare the marginal utility of the two goods and the relative prices at the optimal choice to see if the expected relationship holds. Hint: Label the table columns: 1) Choice, 2} Marginal Gain from More Poems, 3) Marginal Loss from Fewer Cucumbers, 4) Overall Gain or Loss, 5) Is the previous choice Optimal? Label the table rows: 1) 0 Poems and 18 Cucumbers, 2) 1 Poem and 15 cucumbers, 3) 2 Poems and 12 cucumbers, 4) 3 Poems and 9 Cucumbers, 5) 4 Poems and 6 cucumbers 6) 5 Poems and 3 Cucumbers, 7) 6 Poems and 0 Cucumbers.
- Consider a town with a single street of 1 km long with 3,000 people spread uniformly along it. Two stores, 1 and 2, are located at the opposite ends of the street and sell the same product (store 1 is locatedattheleftend).Thecostofwalkingist1 =$6perkmtostore1andt2 =$9perkmtostore2for each consumer. The net utility of a consumer located at point x from buying a product at store 1 is U1(x) = 100 – p1 – t1x, where pi is a price of the product at store i = 1,2. The net utility from buying at store 2 is U2(x) = 100 – p2 – t2(1 – x). The average cost of the product for each store is c = 4. (a) Assume that all consumers buy product from the sellers. Find the demand functions Di(p1,p2) and the profit functions πi(p1,p2) for each store i = 1,2 as functions of prices p1,p2.(b) Find the equilibrium prices.In today’s economy, it’s harder for workers to get promoted. In 2006, it took an averageof 2 ½ years to get a promotion; today it takes 4 ½ years. As a result, fewer workers are willingto boost their productivity in an effort to impress the boss and get the promotion. In 2006, 25percent of employees said they were willing to give “an extra oomph” at work (boost theirproductivity); today about 15 percent are willing to do so. Explain the connection to the Phillipscurve.Pls answer fully with this question, and get tips with leaving ur e-mail on the paper
- Suppose that Abel and Eden spend their incomes on two goods, food (F) and clothing (C).Abel’s preferences are represented by the utility function U(F,C)=10FC, while Eden’spreferences are represented by the utility function U(F,C)= 0.20F2C2A) With food on the horizontal axis and clothing on the vertical axis, identify on a graph theset of points that give Abel the same level of utility as the bundle (10, 5). Do the same forEden on a separate graph.B) On the same two graphs, identify the set of bundles that give Abel and Eden the samelevel of utility as the bundle (15, 8).C) Do you think Abel and Eden have the same preferences or different preferences? Explainu work for a marketing firm that has just landed a contract with Run-of-the-Mills to help them promote three of their products: splishy splashies, flopsicles, and mookies. All of these products have been on the market for some time, but, to entice better sales, Run-of-the-Mills wants to try a new advertisement that will market two of the products that consumers will likely consume together. As a former economics student, you know that complements are typically consumed together while substitutes can take the place of other goods. Run-of-the-Mills provides your marketing firm with the following data: When the price of splishy splashies increases by 4%, the quantity of flopsicles sold increases by 1% and the quantity of mookies sold decreases by 5%. Your job is to use the cross-price elasticity between splishy splashies and the other goods to determine which goods your marketing firm should advertise together. Complete the first column of the following table by computing the…7. Bob receives utility from days spent traveling on vacation domestically (D) and daysspent traveling in a foreign country (F) as given by the utilityU(D; F) = DFThe price of a day spent traveling domestically is 160 pounds and in a foreigncountry 200 pounds. Bobís annual budget for traveling is 8000 pounds. (a) Find Bobís utility maximising choice of days traveling domestically and of daystravelling in a foreign country. Find also his utility level from consuming thatbundle. Suppose that the price of domestic traveling increases to 250 pounds per day.Denoting his budget for traveling x, (suppose by now that it is unknown) findthe demand for D and F under the new prices as a function of x.
- Each day Paul, who is in third grade, eats lunch at school. He likes only Twinkies (t) and soda (s), andthese provide him a utility ofutility = U (t s) =square root (ts).a. If Twinkies cost $0.10 each and soda costs $0.25 per cup, how should Paul spend the $1 hismother gives him in order to maximize his utility?b. If the school tries to discourage Twinkie consumption by raising the price to $0.40, by howmuch will Paul’s mother have to increase his lunch allowance to provide him with the same levelof utility he received in part (a)?1) Suppose that Abel and Eden spend their incomes on two goods, food (F) and clothing (C).Abel’s preferences are represented by the utility function U(F,C)=10FC, while Eden’spreferences are represented by the utility function U(F,C)= 0.20F2C2A) With food on the horizontal axis and clothing on the vertical axis, identify on a graph theset of points that give Abel the same level of utility as the bundle (10, 5). Do the same forEden on a separate graph.B) On the same two graphs, identify the set of bundles that give Abel and Eden the samelevel of utility as the bundle (15, 8).C) Do you think Abel and Eden have the same preferences or different preferences? Explain 2. Graphically show the effect of an increase in price of Coca Cola on the demand of PepsiCola 3. Assume a budget line is drawn for two commodities: X on the x-axis and Y on the y-axis. Ifthe income of the consumer is 120 Birr, the y-intercept is 3, and the slope of the budget lineis -0.5 then determined the price of commodity…Suppose the linear demand curve for shirtsslopes downward and that consumers buy 500 shirts per yearwhen the price is $30 and 1,000 shirts per year when the priceis $25.a. Compared to the prices of $30 and $25, what can you sayabout the marginal valuation that consumers place on the300th shirt, the 700th shirt, and the 1,200th shirt they mightbuy each year?b. With diminishing marginal utility, are consumers derivingany consumer surplus if the price is $25 per shirt? Explain.c. Use a market demand curve to illustrate the change in consumersurplus if the price drops from $30 to $25.
