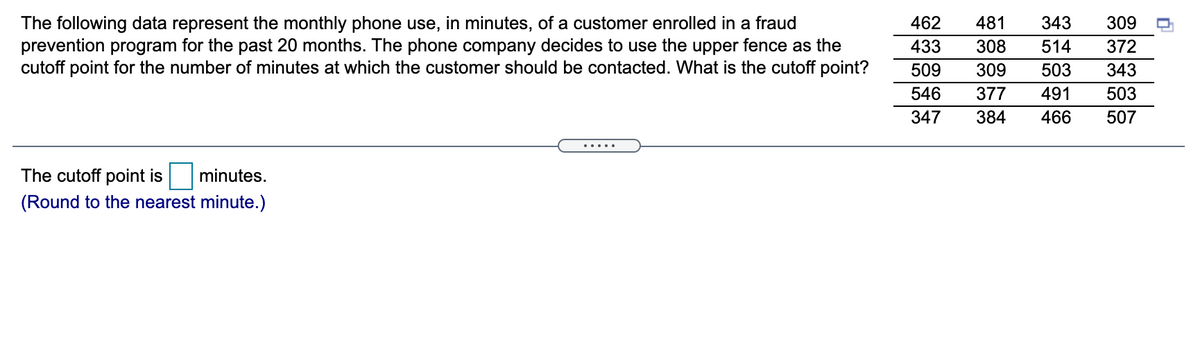
The following data represent the monthly phone use, in minutes, of a customer enrolled in a fraud prevention program for the past 20 months. The phone company decides to use the upper fence as the cutoff point for the number of minutes at which the customer should be contacted. What is the cutoff point? 462 481 343 309 433 308 514 372 509 309 503 343 546 377 491 503 347 384 466 507 ..... The cutoff point is minutes. (Round to the nearest minute.) TITT
Q: Pakistan Surgical Industry has the following data on quantities shipped and unit costs for each of…
A: Suppose the two situations 0 and 1 denote the base period and the current period respectively. Let n…
Q: a consumer analyst collected the following data on the screen sizes of popular LCD televisions sold…
A: Given observation and calculation is shown below
Q: Suppose a government organization reported the accompanying data on the number of speed-related…
A: Given data: Speed-Related Fatalities Year New Years Day (x1) Memorial Day (x2) July 4th (x3)…
Q: Develop a scatter chart for the above data. What does this chart indicate about the relationship…
A:
Q: 427 The following data represent the monthly phone use, in minutes, of a customer enrolled in a…
A: The lower quartile is a value below which 25% of the observations lies and above which 75% of the…
Q: Is there a relation between incidents of child abuse and number of runaway children? A random sample…
A: The given information is as follows:
Q: The table lists the average gestation period (in days) and longevity (in years) for the following…
A: Hi there! Since there are multiple subparts, we will solve the first three subparts for you. To get…
Q: The following data in minute are collected from a shop floor regarding the inspection of different…
A: Given Solution: By using R-software R-output
Q: 2. Consider the following data representing the life in hours of incandescent bulbs. 1,067 919 1,196…
A: “Since you have posted a question with multiple sub-parts, we will solve first three subparts for…
Q: A video media consultant collected the following data on popular LED televisions sold through…
A: We will use excel to determine the regression equation of price (y) on screen (x). This regression…
Q: 319 The following data represent the monthly phone use, in minutes, of a customer enrolled in a…
A:
Q: Estimate the average age of the resident population in the country in 2014. (Assume that "x ≥ 85"…
A: The mid points are 2.5, 10, 20, 30, 40, 50, 60, 70, 80, 95.
Q: A video media consultant collected the following data on popular LED televisions sold through…
A: Hi! Thank you for the question, As per the honour code, we are allowed to answer three sub-parts at…
Q: The following data provide the monthly electricity bills of a sample of households in Cavite: 1084…
A: Given: 1084 1452 764 1348 1180 1276 1000 1212 928 650 708 796 1064 1116 820 1116 768 724 1284 1236…
Q: 1. The following data represent the time for jogging, recorded to the nearest tenth of a minute,…
A: The solution is as follows,
Q: Write the estimated regression equation using the least squares estimates for b0b0 and b1b1
A: It is given that Intercept b0 = 477.24183007 And coefficient of month b1 = 26.73477812
Q: The following data has been collected on the interarrival times of patients to an emergency…
A: From provided information, the interarrival times of patients to an emergency department is given as…
Q: Is there a relation between incidents of child abuse and number of runaway children? A random sample…
A: The given table shows the number of incidents of child abuse and the number of runaway children.
Q: The following data are the Medical Expenses in each of the 50 states. Using descriptive statistics,…
A: Note: Hi there! Thank you for posting the question. As your question has more than 3 parts, we have…
Q: Consider the following data set on the monthly rent ($) for a sample of one-bedroom apartments: 425…
A: Given data…
Q: Is there a relation between incidents of child abuse and number of runaway children? A random sample…
A: Given Information : A random sample of cities (over 10,000 population) gave the following…
Q: The following data were used to construct the histograms of the number of days required to fill…
A: Given:
Q: The following is two years monthly sales data of 5different outlets of a well-known textile brand.…
A: ANOVA: ANOVA is useful to check the Significance difference between 3 or more than 3 group means.…
Q: i need Solution with using 50 values of data Data: 25 2 7 1 21 7 21 27 27 8 21 28 4 26 23 10 17 20…
A: data :…
Q: The accompanying table shows movie attendance data collected by an agency during the period 2012 to…
A: CE.40 Part d: Percent of admissions in 2016 bought by people 60 years or older = 1311317×100 = 9.9%…
Q: The following data represent the living situation of newlyweds in a large metropolitan area and…
A:
Q: Here are the collected data on weekly sales commissions: Weekly Commission New Plan Old Plan 1 2 3 4…
A: Given Information: Consider the given weekly sales commission data.
Q: How do I create a stem and leaf plot on StatCrunch, or by hand, with this data?
A: Best Actor Age.First arrange the data in ascending order.28, 30, 30, 32, 36, 36, 37, 38, 43, 44, 44,…
Q: The following data set provides information about the City of Somerville Assessors Valuation for the…
A: Commercial: Standard deviation for Total Assessed Land Value: The standard deviation is 4361842…
Q: 2. Consider the following data representing the life in hours of incandescent bulbs. 1,067 919 1,196…
A: Since you posted a question with multiple subparts, we will solve first three subparts for you. To…
Q: A researcher is interested to see if income is related to education level. Income (Dollars)…
A: Given: Income (Dollars) Education (Years) 36577 11 54365 12 33542 10 65654 12 45765 11…
Q: The following is two years monthly sales data of 5different outlets of a well-known textile brand.…
A:
Q: b) The following data displays the budgets, in dollars, of 45 randomly sampled home improvement jobs…
A: i)Given data of budgets of home improved jobsSample size n=45Population standard deviation…
Q: The following data represent the ages of award winners for best actor and best actress in a leading…
A: Given that The data of best actor ages 31,52,41,60,49,42,31,38,38,46,54,41,34,39,38,46,53,52,26,61…
Q: Pinky Bauer, Chief Financial Officer of Harrison Haulers, Inc., suspects irregularities in the…
A:
Q: The following data displays the budgets, in dollars, of 45 randomly sampled home improvement jobs in…
A: The mean is given by
Q: The table below contains real data for the first two decades of AIDS reporting. Year # AIDS cases…
A: Excluding the pre-1981 data, we have 22 observations from 1981-2002. The scatterplot is
Q: The following contingency table is on Autism and Breastfeeding: Autism None Less than 2 months 2 to…
A: Given data: Autism None Less than 2 months 2 to 6 months More than 6 months Total Yes 241 198…
Q: A video media consultant collected the following data on popular LED televisions sold through…
A: Given : Data
Q: E. G. is the director of the student scholarships of the Wildernese College, with data available…
A: Given: Summer Income Number of students 0-499 231 500-999 304 1000-1499 400 1500-1999…
Q: 2. Considerthe following data representing the life in hours of incandescent bulbs. 1,067 919 1,196…
A: Data is given We have to calculate : P55, D9, Q3 We have to construct frequency table and histogram…
Q: All companies are rightly concerned about the income disparity between Males and Females and…
A: Let μ1 denotes the mean income of males and μ2 denotes the mean income of females. Given: Data on…
Q: The following data show the number of issues from Initial Public Offerings (IPOS) from 2006 to 2019…
A: (a). Obtain the 3-period moving average forecasts for the given data: Given data represents the…
Q: The following frequency distribution that represents the number of minutes participants travel to…
A: Given that Number of Minutes to Work Frequency 0 - 9 188 10 – 19 375 20 – 29…
Q: s there a relation between incidents of child abuse and number of runaway children? A random sample…
A: a. From the given information, City Abuse Rank X Runaways Rank y Rank(X) Rank(Y)…
Q: The data below reflects the 1991-92 Reunion Class Giving of SUNY Albany alumni. Class Year Average…
A: The independent variable is Class Year. The dependent variable is Total Giving. We have to find the…
Q: The following data represent the number of people aged 25-64 covered by health insurance in 1998.…
A:
Q: Obtain the five-number summary for the given data. The weekly salaries (in dollars) of sixteen…
A: Five number summary : The 5 number summary for any number series like minimum and maximum number,…
Q: The following data were used to construct the histograms of the number of days required to fill…
A: The standard deviation of a set of observations is given by : SD = 1(total number of…
Q: The following frequency distribution gives the credit card debt of bank customers. Debt Frequency…
A:
Trending now
This is a popular solution!
Step by step
Solved in 3 steps
- A group of nutritionists is hoping to show that a new soybean compound has more protein per gram than roast beef, which has a mean protein content of 20 grams. A random sample of 5 batches of a large supply of soy compound have been tested, producing protein contents of 15, 22, 17, 18, and 23 grams. Which of the following conditions have been met?I. The data is a random sample from the population of interest.II. The sample size is less than 10% of the population size.III. The sample size is large. Group of answer choices I only I and II I, II and III II only III onlyA random sample of stipends for teaching assistants in economics is listed. Is there sufficientevidence at a = 0.0 level to conclude that the average stipend greater than $15,000?S14.000 $18,000 $12,000 $14,356 $13,185 $13,419 $14.000 $11,981 $17,604 $12,283 $16,338 $15.000A bank with a branch located in a commercial district of a city has the business objective of improving the process for serving customers during the noon-to-1 PM lunch period. To do so, the waiting time (defined as the number of minutes that elapses from when the customer enters the line until he or she reaches the teller window) needs to be shortened to increase customer satisfaction. Another bank in the area is also concerned with the noon-to-1 PM lunch period. A random sample of 12 customers is selected from each bank and the waiting times are the following: Bank 1: 4.02 4.13 4.05 4.09 3.2 3.79 4.95 4.74 4.29 4.7 3.8 3.18 Bank 2: 2.28 3.85 1.61 3.25 2.82 2.61 3.93 2.13 3.03 1.89 3.7 2.45 Is there evidence of a difference in the variability of the waiting time between the two branches? (alpha = 0.05) a. What are the null and alternate hypotheses? H0: H1:…
- A bank with a branch located in a commercial district of a city has the business objective of improving the process for serving customers during the noon-to-1 PM lunch period. To do so, the waiting time (defined as the number of minutes that elapses from when the customer enters the line until he or she reaches the teller window) needs to be shortened to increase customer satisfaction. Another bank in the area is also concerned with the noon-to-1 PM lunch period. A random sample of 12 customers is selected from each bank and the waiting times are the following: Bank 1: 4.02 4.13 4.05 4.09 3.2 3.79 4.95 4.74 4.29 4.7 3.8 3.18 Bank 2: 2.28 3.85 1.61 3.25 2.82 2.61 3.93 2.13 3.03 1.89 3.7 2.45 Is there evidence of a difference in the variability of the waiting time between the two branches? (alpha = 0.05) c. Compute the value of the test statistic? (Round your answer to 2 decimal places. Negative values should have a minus sign in front of them) d.…Current Attempt in Progress Dorothy Little purchased a mailing list of 2,000 names and addresses for her mail order business, but after scanning the list she doubts the authenticity of the list. She randomly selects five names from the list for validation. If 40% of the names on the list are non-authentic, and x is the number on non-authentic names in her sample, the expected (average) value of x is ______________. 1.35 1.50 1.25 2.00 2.50Nana AB. supplies a range of computer hardware and software to 2000 schools within a large municipal region of Spain. When Nana AB. won the contract the issue of customer service was considered to be central to the company being successful at the final bidding stage. The company has now requested that its customer service director creates a series of graphical representations of the data to illustrate customer satisfaction with the service. The following data has been collected during the last six months and measures the time to respond to the received complaint (days).52434661563832 87783496745423 5632861281325253 3445213142125321 437662127336712 7889261074782332 2621567891851512 1556452145262134 2812672324432565 238872178547679 The customer service director has analysed this data to create a grouped frequency table and plotted the histogram. From this he made a series of observations regarding the time to respond to customer complaints. He now wishes to extend the analysis to use…
- Use the p value method and fill in the blanks to address the claim: A supplier of digital memory cards claims that less than 1% of the cards are defective. In a random sample of 600 memory cards, it is found that 1.5% are defective, but the supplier claims that this is only a sample fluctuation. At the 0.01 level of significance, test the supplier's claim that less than 1% are defective. Please give answers to the following with details, and calculator steps Claim: _________________________________________________ H0 H1 P0 x n z p Since p __________ a, we ___________ the null hypothesis. Final statement: _________________________________________Professional Golfers’ Earnings Two random samples of earnings of professional golfers were selected. One sample was taken from the Professional Golfers Association, and the other was taken from the Ladies Professional Golfers Association. At α=0.10, is there a difference in the means? The data are in thousands of dollars. Use the critical value method with tables. PGA 446 1147 1344 9188 5687 4910 8553 7573 375 LPGA 48 76 122 466 863 100 1876 2029 4364 2921 (a)State the hypotheses and identify the claim. H0: claim/ do not claim H1: claim/do not claim This hypothesis test one tailed/two tailed a (Choose one) test. (b)Find the critical value. Round the answer to at least two decimal places. Critical value is . Critical value is (c)Compute the test value. Round the standard deviations and F score values to at least two decimal places as needed. F= (d)Make the decision.…Does a statistics course improve a student's mathematics skills,as measured by a national test? Suppose a random sample of 13 students takes the same national mathematics exam prior to enrolling in a stats course and just after completing the course. At a 1% level of significance determine whether the scores after the stats course are significantly higher than the scores before. Take the differences = before - after. Before After430 465485 475520 535360 410440 425500 505425 450470 480515 520430 430450 460495 500540 530 What type of alternative hypothesis is appropriate for this research question? Locate student 9 in the dataset. What rank will be given to this student? What is the value of the test statistic, T? Give answer to 1 decimal place What is the critical value for the study? (Hint: student 10 will be dropped from the analysis, since the scores are the same before and after the stats…
- A researcher studying air quality in a metropolitan city is interested in testing the claim that less than 20% of people smoke cigarettes to test this claim the researcher collects the following data on a sample of 700 adults and 110 of them smoke cigarettes the following is the data from the study. Sample size= 700 adults Alternative hypothesis= ha:pA financial analyst of Woolworths is interested in the average number of months that it takes customers to pay off their account debt. He claims that the average number of months it takes is less than four. He takes a sample of fifty customers and records the number of months it takes each customer to pay off his debt. Suppose that the test statistic value to test this claim is calculated as -0.34, determine the p-value.The federal government recently granted funds for a special program designed to reduce crime in high-crime areas. A study of the results of the program in eight high-crime areas of Miami, Florida, yielded the following results. Number of Crimes by Area A B C D E F G H Before 14 7 4 5 17 12 8 9 After 2 7 3 6 8 13 3 5 Has there been a decrease in the number of crimes since the inauguration of the program? Use the 0.01 significance level. Estimate the p-value. Compute the value of the test statistic. (Round your answer to 2 decimal places.)