The following diagram shows supply and demand in the market for smartphones. Use the black point (plus symbol) to indicate the equilibrium price and quantity of smartphones. Then use the green point (triangle symbol) to fill the area representing consumer surplus, and use the purple point (diamond symbol) to fill the area representing producer surplus. 150 Demand 135 Equilibrium 120 105 90 Consumer Surplus 75 60 Producer Surplus 45 30 15 Supply 50 100 150 200 250 300 250 400 450 500 QUANTITY (Millions of phones) Total surplus in this market is $ million. PRICE (Dollars per phone)
The following diagram shows supply and demand in the market for smartphones. Use the black point (plus symbol) to indicate the equilibrium price and quantity of smartphones. Then use the green point (triangle symbol) to fill the area representing consumer surplus, and use the purple point (diamond symbol) to fill the area representing producer surplus. 150 Demand 135 Equilibrium 120 105 90 Consumer Surplus 75 60 Producer Surplus 45 30 15 Supply 50 100 150 200 250 300 250 400 450 500 QUANTITY (Millions of phones) Total surplus in this market is $ million. PRICE (Dollars per phone)

Chapter4: Demand, Supply, And Market Equilibrium
Section: Chapter Questions
Problem 4P

Related questions
Question
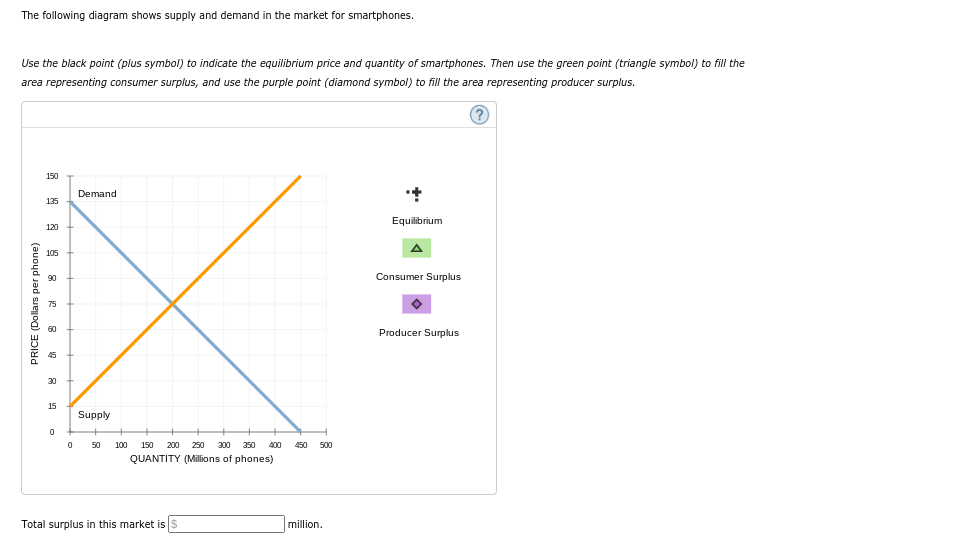
The following diagram shows supply and demand in the market for smartphones.
Use the black point (plus symbol) to indicate the equilibrium price and quantity of smartphones. Then use the green point (triangle symbol) to fill the area representing consumer surplus , and use the purple point (diamond symbol) to fill the area representing producer surplus .
Total surplus in this market is ________ million.
Transcribed Image Text:The following diagram shows supply and demand in the market for smartphones.
Use the black point (plus symbol) to indicate the equilibrium price and quantity of smartphones. Then use the green point (triangle symbol) to fill the
area representing consumer surplus, and use the purple point (diamond symbol) to fill the area representing producer surplus.
150
Demand
135
Equilibrium
120
105
90
Consumer Surplus
75
60
Producer Surplus
45
30
15
Supply
50
100
150
200
250
300
350
400
450
500
QUANTITY (Millions of phones)
Total surplus in this market is $
million.
PRICE (Dollars per phone)
Expert Solution
This question has been solved!
Explore an expertly crafted, step-by-step solution for a thorough understanding of key concepts.

This is a popular solution!

Trending now
This is a popular solution!

Step by step
Solved in 2 steps with 1 images

Knowledge Booster


Learn more about
Need a deep-dive on the concept behind this application? Look no further. Learn more about this topic, economics and related others by exploring similar questions and additional content below.Recommended textbooks for you
Exploring Economics
Economics
ISBN:
9781544336329
Author:
Robert L. Sexton
Publisher:
SAGE Publications, Inc


Economics (MindTap Course List)
Economics
ISBN:
9781337617383
Author:
Roger A. Arnold
Publisher:
Cengage Learning
Exploring Economics
Economics
ISBN:
9781544336329
Author:
Robert L. Sexton
Publisher:
SAGE Publications, Inc
Economics (MindTap Course List)
Economics
ISBN:
9781337617383
Author:
Roger A. Arnold
Publisher:
Cengage Learning


Microeconomics: Principles & Policy
Economics
ISBN:
9781337794992
Author:
William J. Baumol, Alan S. Blinder, John L. Solow
Publisher:
Cengage Learning

Macroeconomics: Private and Public Choice (MindTa…
Economics
ISBN:
9781305506756
Author:
James D. Gwartney, Richard L. Stroup, Russell S. Sobel, David A. Macpherson
Publisher:
Cengage Learning