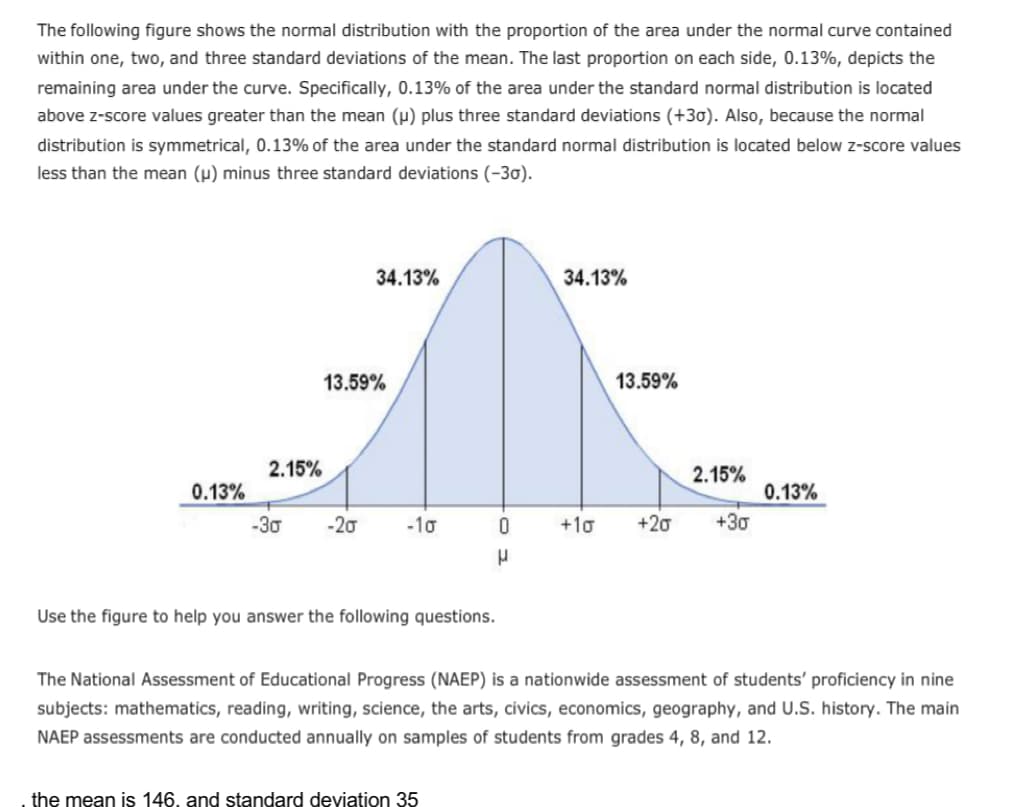
The following figure shows the normal distribution with the proportion of the area under the normal curve contained within one, two, and three standard deviations of the mean. The last proportion on each side, 0.13%, depicts the remaining area under the curve. Specifically, 0.13% of the area under the standard normal distribution is located above z-score values greater than the mean (P) plus three standard deviations (+30). Also, because the normal distribution is symmetrical, 0.13% of the area under the standard normal distribution is located below z-score values less than the mean (µ) minus three standard deviations (-30). 34.13% 34.13% 13.59% 13.59% 2.15% 2.15% 0.13% 0.13% -30 -20 -10 +10 +20 +30 Use the figure to help you answer the following questions. The National Assessment of Educational Progress (NAEP) is a nationwide assessment of students' proficiency in nine subjects: mathematics, reading, writing, science, the arts, civics, economics, geography, and U.S. history. The main NAEP assessments are conducted annually on samples of students from grades 4, 8, and 12. the mean is 146. and standard deviation 35


Inverse Normal Distribution
The method used for finding the corresponding z-critical value in a normal distribution using the known probability is said to be an inverse normal distribution. The inverse normal distribution is a continuous probability distribution with a family of two parameters.
Mean, Median, Mode
It is a descriptive summary of a data set. It can be defined by using some of the measures. The central tendencies do not provide information regarding individual data from the dataset. However, they give a summary of the data set. The central tendency or measure of central tendency is a central or typical value for a probability distribution.
Z-Scores
A z-score is a unit of measurement used in statistics to describe the position of a raw score in terms of its distance from the mean, measured with reference to standard deviation from the mean. Z-scores are useful in statistics because they allow comparison between two scores that belong to different normal distributions.
the mean is 146, and standard deviation is 35. A score of 181 is how many z-scores above the mean?


Trending now
This is a popular solution!

Step by step
Solved in 2 steps with 2 images


