The following graph represents the money market in a hypothetical economy. As in the United States, this economy has a central bank called the Fed, but unlike in the United States, the economy is closed (that is, the economy does not interact with other economies in the world). The money market is currently in equilibrium at an interest rate of 4% and a quantity of money equal to $0.4 trillion, as indicated by the grey star. 6.0 5.5 New MS Curve Money Demand 5.0 4.5 New Equilibrium 4.0 3.5 3.0 2.5 Money Supply 2.0 0.1 0.2 0.3 0.4 0.5 0.6 0.7 0.8 MONEY (Trillions of dollars) Suppose the Fed announces that it is lowering its target interest rate by 75 basis points, or 0.75 percentage point. To do this, the Fed will use open- the public. market operations to the money by Use the green line (triangle symbol) on the previous graph to illustrate the effects of this policy by placing the new money supply curve (MS) in the correct location. Place the black point (plus symbol) at the new equilibrium interest rate and quantity of money. INTEREST RATE (Percent) Suppose the following graph shows the aggregate demand curve for this economy. The Fed's policy of targeting a lower interest rate will the cost of borrowing, causing residential and business investment spending to and the quantity of output demanded to at each price level. Shift the curve on the graph to show the general impact of the Fed's new interest rate target on aggregate demand. Aggregate Demand Aggregate Demand OUTPUT PRICE LEVEL
The following graph represents the money market in a hypothetical economy. As in the United States, this economy has a central bank called the Fed, but unlike in the United States, the economy is closed (that is, the economy does not interact with other economies in the world). The money market is currently in equilibrium at an interest rate of 4% and a quantity of money equal to $0.4 trillion, as indicated by the grey star. 6.0 5.5 New MS Curve Money Demand 5.0 4.5 New Equilibrium 4.0 3.5 3.0 2.5 Money Supply 2.0 0.1 0.2 0.3 0.4 0.5 0.6 0.7 0.8 MONEY (Trillions of dollars) Suppose the Fed announces that it is lowering its target interest rate by 75 basis points, or 0.75 percentage point. To do this, the Fed will use open- the public. market operations to the money by Use the green line (triangle symbol) on the previous graph to illustrate the effects of this policy by placing the new money supply curve (MS) in the correct location. Place the black point (plus symbol) at the new equilibrium interest rate and quantity of money. INTEREST RATE (Percent) Suppose the following graph shows the aggregate demand curve for this economy. The Fed's policy of targeting a lower interest rate will the cost of borrowing, causing residential and business investment spending to and the quantity of output demanded to at each price level. Shift the curve on the graph to show the general impact of the Fed's new interest rate target on aggregate demand. Aggregate Demand Aggregate Demand OUTPUT PRICE LEVEL

Chapter26: Monetary Policy
Section: Chapter Questions
Problem 4SQP

Related questions
Question
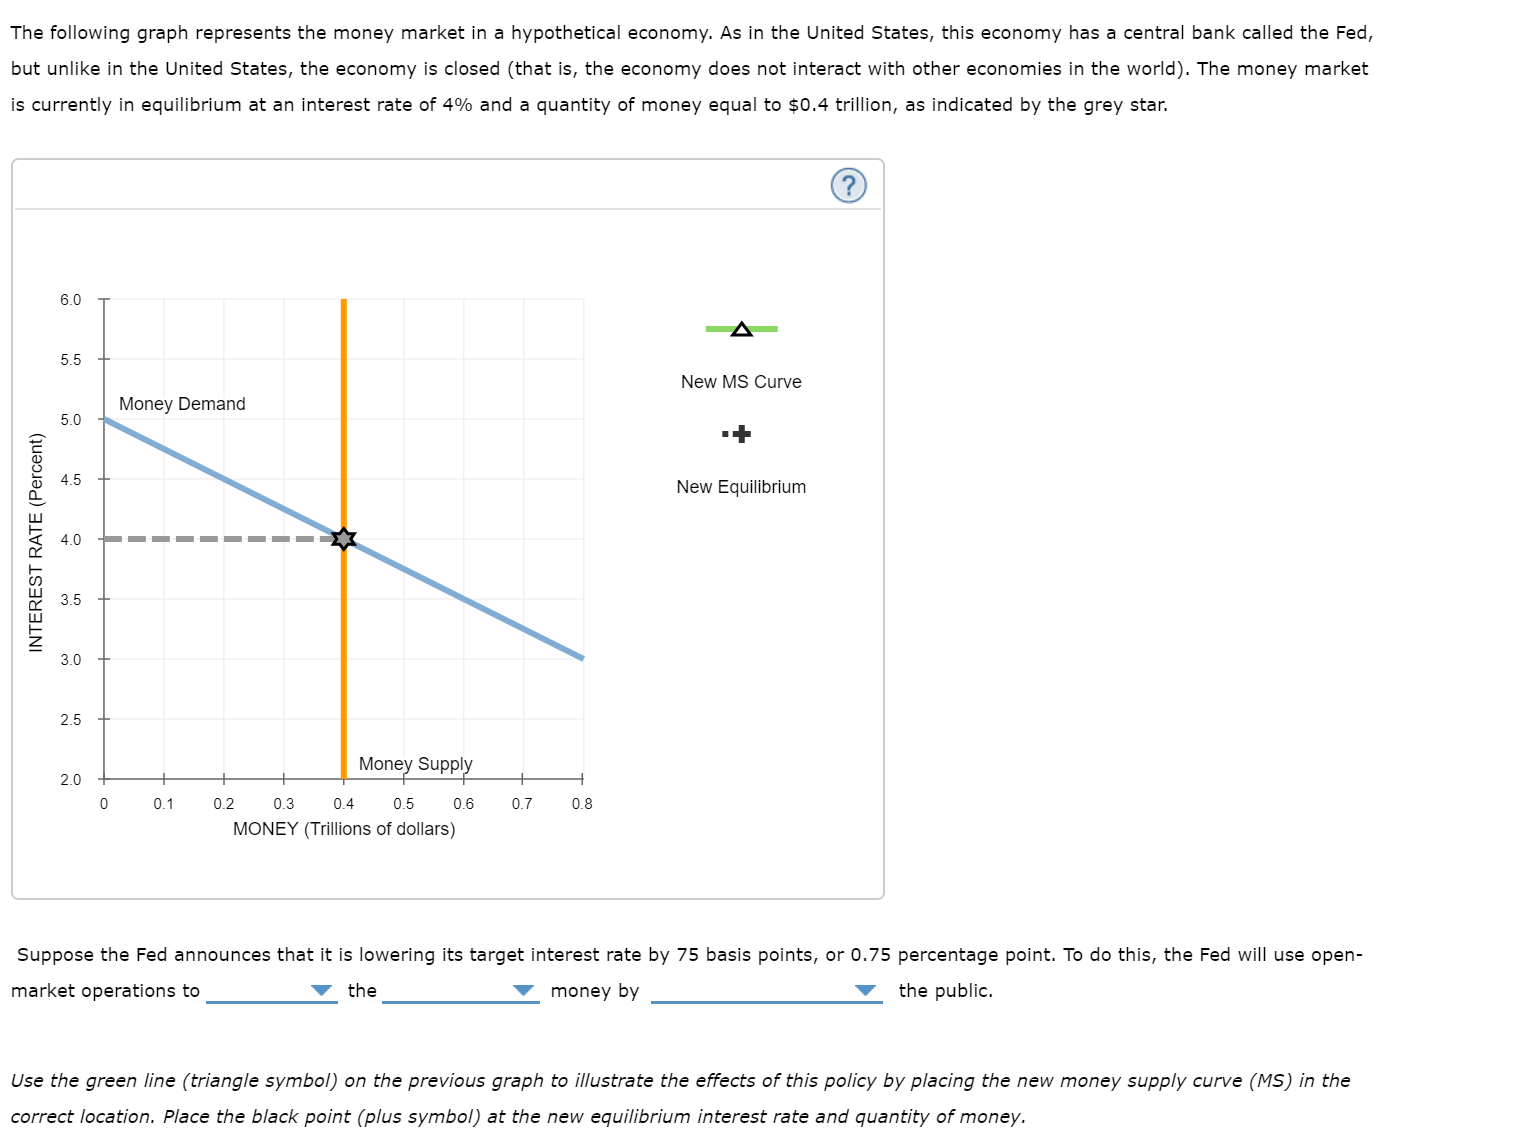
Transcribed Image Text:The following graph represents the money market in a hypothetical economy. As in the United States, this economy has a central bank called the Fed,
but unlike in the United States, the economy is closed (that is, the economy does not interact with other economies in the world). The money market
is currently in equilibrium at an interest rate of 4% and a quantity of money equal to $0.4 trillion, as indicated by the grey star.
6.0
5.5
New MS Curve
Money Demand
5.0
4.5
New Equilibrium
4.0
3.5
3.0
2.5
Money Supply
2.0
0.1
0.2
0.3
0.4
0.5
0.6
0.7
0.8
MONEY (Trillions of dollars)
Suppose the Fed announces that it is lowering its target interest rate by 75 basis points, or 0.75 percentage point. To do this, the Fed will use open-
the public.
market operations to
the
money by
Use the green line (triangle symbol) on the previous graph to illustrate the effects of this policy by placing the new money supply curve (MS) in the
correct location. Place the black point (plus symbol) at the new equilibrium interest rate and quantity of money.
INTEREST RATE (Percent)
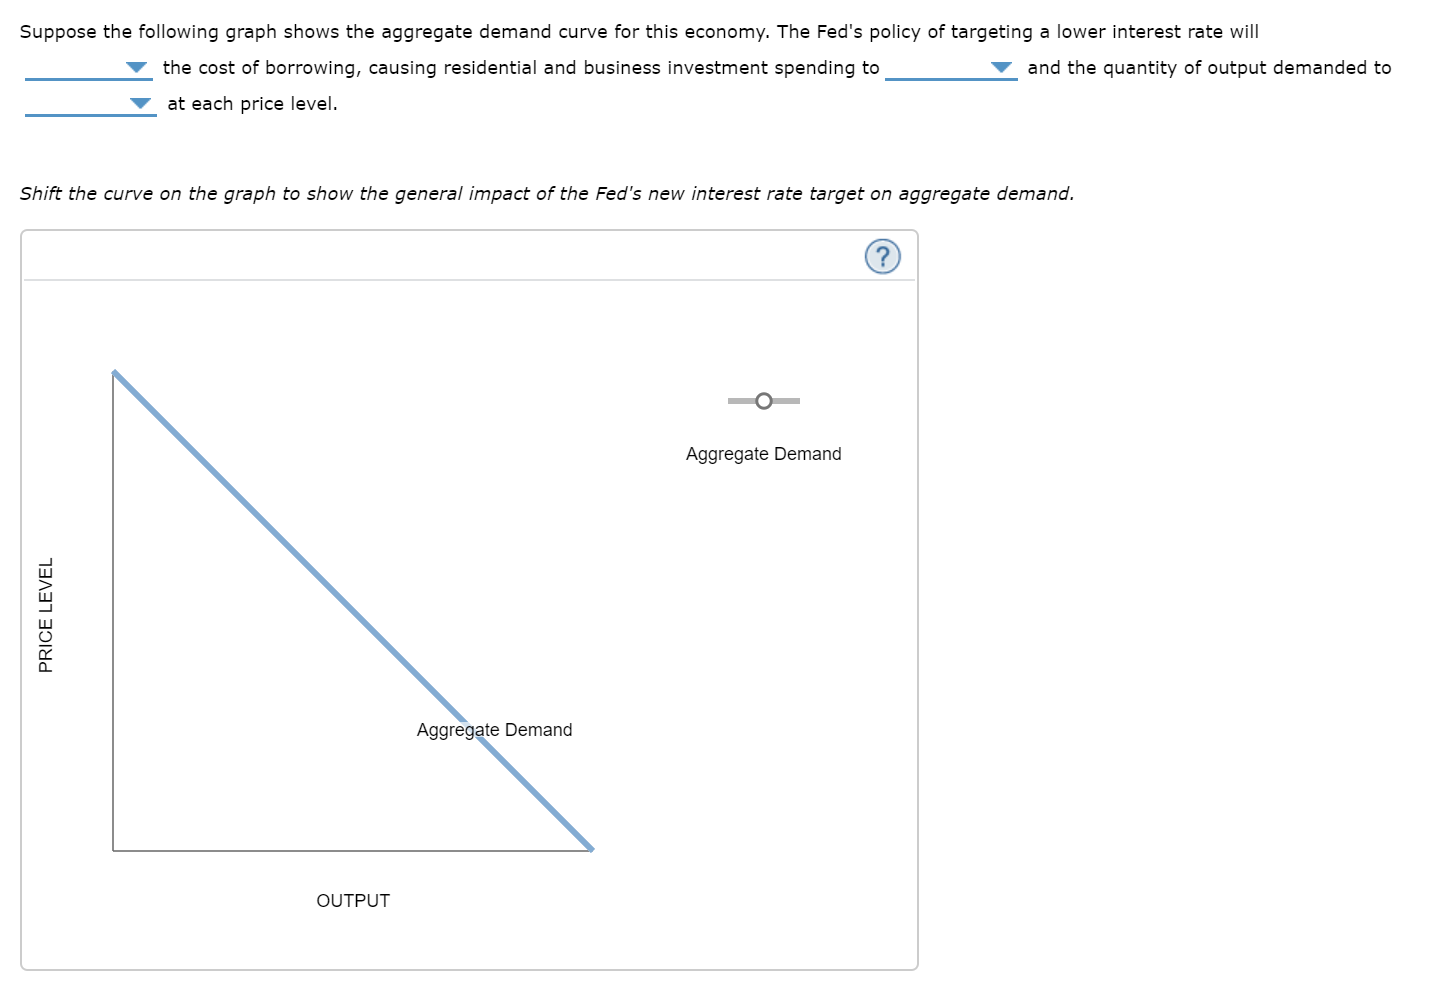
Transcribed Image Text:Suppose the following graph shows the aggregate demand curve for this economy. The Fed's policy of targeting a lower interest rate will
the cost of borrowing, causing residential and business investment spending to
and the quantity of output demanded to
at each price level.
Shift the curve on the graph to show the general impact of the Fed's new interest rate target on aggregate demand.
Aggregate Demand
Aggregate Demand
OUTPUT
PRICE LEVEL
Expert Solution
This question has been solved!
Explore an expertly crafted, step-by-step solution for a thorough understanding of key concepts.

This is a popular solution!

Trending now
This is a popular solution!

Step by step
Solved in 2 steps with 2 images

Recommended textbooks for you


Macroeconomics: Private and Public Choice (MindTa…
Economics
ISBN:
9781305506756
Author:
James D. Gwartney, Richard L. Stroup, Russell S. Sobel, David A. Macpherson
Publisher:
Cengage Learning

Economics: Private and Public Choice (MindTap Cou…
Economics
ISBN:
9781305506725
Author:
James D. Gwartney, Richard L. Stroup, Russell S. Sobel, David A. Macpherson
Publisher:
Cengage Learning

Exploring Economics
Economics
ISBN:
9781544336329
Author:
Robert L. Sexton
Publisher:
SAGE Publications, Inc