The following graph shows the economy in long-run equilibrium at the expected price level of 120 and the natural level of output of $600 billion. Suppose the government increases spending on building and repairing highways, bridges, and ports. Shift the short-run aggregate supply (AS) curve or the aggregate demand (AD) curve to show the short-run impact of the increase in government spending. 240 AS 200 AD 160 AS 120 80 AD 40 200 400 600 800 1000 1200 OUTPUT (Billions of dollars) In the short run, the increase in government spending on infrastructure causes the price level to the price level people expected and the quantity of output to the natural level of output. The increase in government spending will cause the unemployment rate to the natural rate of unemployment in the short run. Again, the following graph shows the economy in long-run equilibrium at the expected price level of 120 and the natural level of output of $600 billion, before the increase in government spending on infrastructure. PRICE LEVEL During the transition from the short run to the long run, price-level expectations will and the curve will shift to the Now show the long-run impact of the increase in government spending by shifting both the aggregate demand (AD) curve and the short-run aggregate supply (AS) curve to the appropriate positions. 240 AS 200 AD 160 AS 120 80 AD 40 200 400 600 800 1000 1200 OUTPUT (Billions of dollars) In the long run, as a result of the increase in government spending, the price level the quantity of output the natural rate of unemployment. the natural level of output, and the unemployment rate PRICE LEVEL
The following graph shows the economy in long-run equilibrium at the expected price level of 120 and the natural level of output of $600 billion. Suppose the government increases spending on building and repairing highways, bridges, and ports. Shift the short-run aggregate supply (AS) curve or the aggregate demand (AD) curve to show the short-run impact of the increase in government spending. 240 AS 200 AD 160 AS 120 80 AD 40 200 400 600 800 1000 1200 OUTPUT (Billions of dollars) In the short run, the increase in government spending on infrastructure causes the price level to the price level people expected and the quantity of output to the natural level of output. The increase in government spending will cause the unemployment rate to the natural rate of unemployment in the short run. Again, the following graph shows the economy in long-run equilibrium at the expected price level of 120 and the natural level of output of $600 billion, before the increase in government spending on infrastructure. PRICE LEVEL During the transition from the short run to the long run, price-level expectations will and the curve will shift to the Now show the long-run impact of the increase in government spending by shifting both the aggregate demand (AD) curve and the short-run aggregate supply (AS) curve to the appropriate positions. 240 AS 200 AD 160 AS 120 80 AD 40 200 400 600 800 1000 1200 OUTPUT (Billions of dollars) In the long run, as a result of the increase in government spending, the price level the quantity of output the natural rate of unemployment. the natural level of output, and the unemployment rate PRICE LEVEL

Chapter20: Aggregate Demand And Supply
Section: Chapter Questions
Problem 8SQP

Related questions
Question
100%
8. Economic fluctuations I
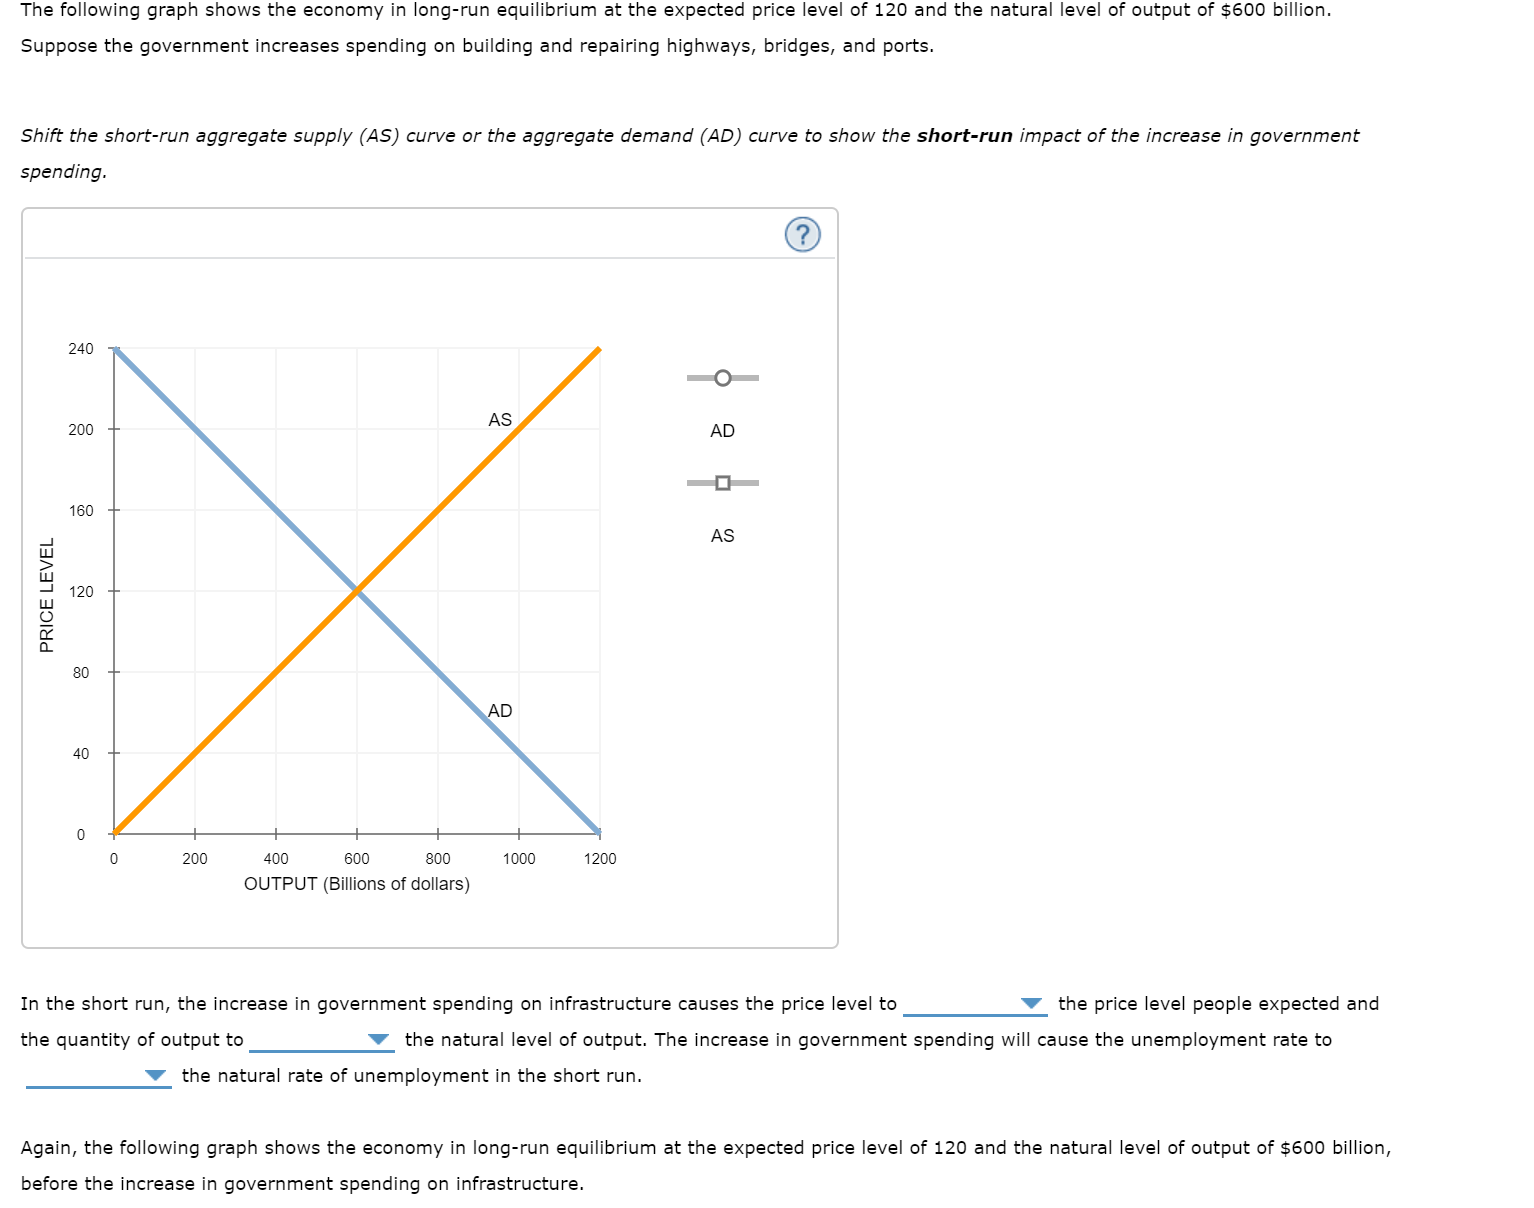
The following graph shows the economy in long-run equilibrium at the expected price level of 120 and the natural level of output of $600 billion. Suppose the government increases spending on building and repairing highways, bridges, and ports.
Shift the short-run aggregate supply (AS) curve or the aggregate demand (AD) curve to show the short-run impact of the increase in government spending.
Transcribed Image Text:The following graph shows the economy in long-run equilibrium at the expected price level of 120 and the natural level of output of $600 billion.
Suppose the government increases spending on building and repairing highways, bridges, and ports.
Shift the short-run aggregate supply (AS) curve or the aggregate demand (AD) curve to show the short-run impact of the increase in government
spending.
240
AS
200
AD
160
AS
120
80
AD
40
200
400
600
800
1000
1200
OUTPUT (Billions of dollars)
In the short run, the increase in government spending on infrastructure causes the price level to
the price level people expected and
the quantity of output to
the natural level of output. The increase in government spending will cause the unemployment rate to
the natural rate of unemployment in the short run.
Again, the following graph shows the economy in long-run equilibrium at the expected price level of 120 and the natural level of output of $600 billion,
before the increase in government spending on infrastructure.
PRICE LEVEL
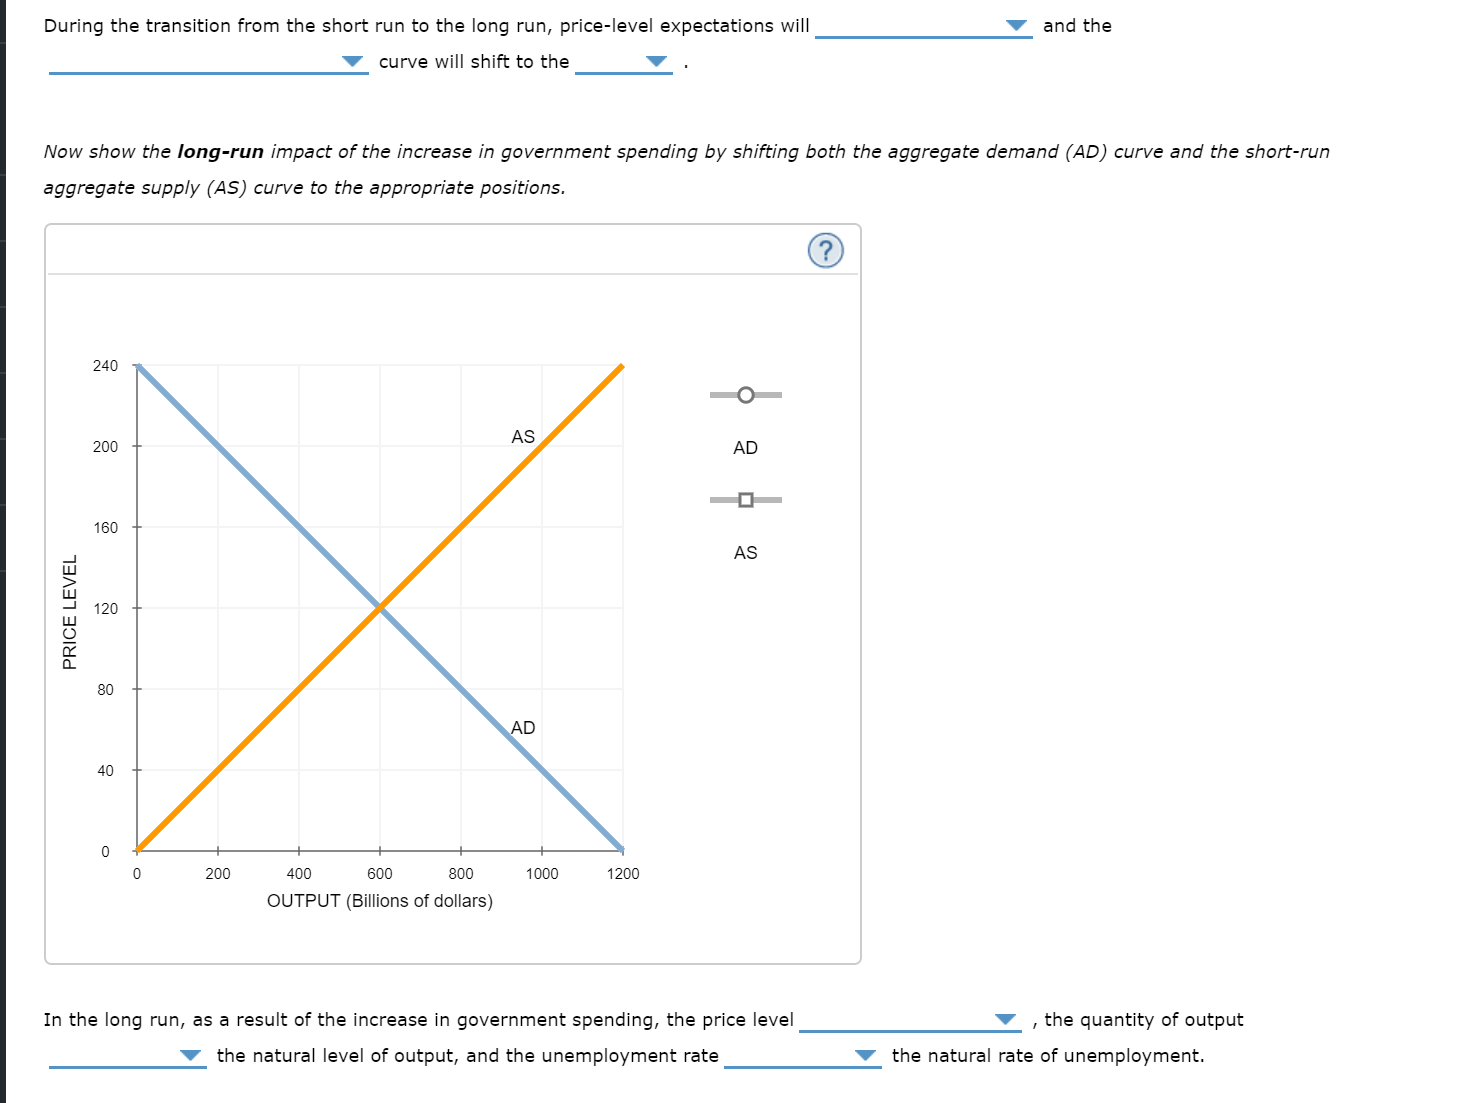
Transcribed Image Text:During the transition from the short run to the long run, price-level expectations will
and the
curve will shift to the
Now show the long-run impact of the increase in government spending by shifting both the aggregate demand (AD) curve and the short-run
aggregate supply (AS) curve to the appropriate positions.
240
AS
200
AD
160
AS
120
80
AD
40
200
400
600
800
1000
1200
OUTPUT (Billions of dollars)
In the long run, as a result of the increase in government spending, the price level
the quantity of output
the natural rate of unemployment.
the natural level of output, and the unemployment rate
PRICE LEVEL
Expert Solution
This question has been solved!
Explore an expertly crafted, step-by-step solution for a thorough understanding of key concepts.

This is a popular solution!

Trending now
This is a popular solution!

Step by step
Solved in 3 steps with 3 images

Knowledge Booster


Learn more about
Need a deep-dive on the concept behind this application? Look no further. Learn more about this topic, economics and related others by exploring similar questions and additional content below.Recommended textbooks for you


Macroeconomics: Principles and Policy (MindTap Co…
Economics
ISBN:
9781305280601
Author:
William J. Baumol, Alan S. Blinder
Publisher:
Cengage Learning

Economics (MindTap Course List)
Economics
ISBN:
9781337617383
Author:
Roger A. Arnold
Publisher:
Cengage Learning
