The following graph shows the market for euros, which is initially in equilibrium. Suppose an economic expansion in the United States leads to an increase in the incomes of American households, causing imports from Europe to rise. On the graph, illustrate the effect of an economic expansion on the market for euros by shifting the appropriate curve or curves. 4.0 3.5 Supply Demand 3.0 2.5 Supply 2.0 Flexible exchange rates 1.5 1.0 Demand Fixed exchange rates 0.5 2 6 8. 10 12 14 16 QUANTITY OF EUROS (Billions) EXCHANGE RATE (Dollars per euro) On the graph, use the purple point (diamond symbol) to indicate the new equilibrium exchange rate and quantity under a system of flexible exchange rates. Under a system of flexible exchange rates, the dollar will until the foreign exchange market reaches an equilibrium exchange rate of Now suppose that the United States wants to maintain the initial equilibrium exchange rate of $2 per euro. On the graph, use a grey point (star symbol) to indicate the new equilibrium under a system of fixed exchange rates. Under system of fixed exchange rates, which of the following policies could the U.S. government use to prevent the change in demand for euros from driving the exchange rate to the new equilibrium? Check all that apply. O Subsidize the production of certain U.S. exports to Europe O Increase income taxes in the United States O Sell dollars for euros in the foreign exchange market
The following graph shows the market for euros, which is initially in equilibrium. Suppose an economic expansion in the United States leads to an increase in the incomes of American households, causing imports from Europe to rise. On the graph, illustrate the effect of an economic expansion on the market for euros by shifting the appropriate curve or curves. 4.0 3.5 Supply Demand 3.0 2.5 Supply 2.0 Flexible exchange rates 1.5 1.0 Demand Fixed exchange rates 0.5 2 6 8. 10 12 14 16 QUANTITY OF EUROS (Billions) EXCHANGE RATE (Dollars per euro) On the graph, use the purple point (diamond symbol) to indicate the new equilibrium exchange rate and quantity under a system of flexible exchange rates. Under a system of flexible exchange rates, the dollar will until the foreign exchange market reaches an equilibrium exchange rate of Now suppose that the United States wants to maintain the initial equilibrium exchange rate of $2 per euro. On the graph, use a grey point (star symbol) to indicate the new equilibrium under a system of fixed exchange rates. Under system of fixed exchange rates, which of the following policies could the U.S. government use to prevent the change in demand for euros from driving the exchange rate to the new equilibrium? Check all that apply. O Subsidize the production of certain U.S. exports to Europe O Increase income taxes in the United States O Sell dollars for euros in the foreign exchange market

Chapter28: International Trade And Finance
Section: Chapter Questions
Problem 11SQP

Related questions
Question
The following graph shows the market for euros, which is initially in equilibrium. Suppose an economic expansion in the United States leads to an increase in the incomes of American households, causing imports from Europe to rise.
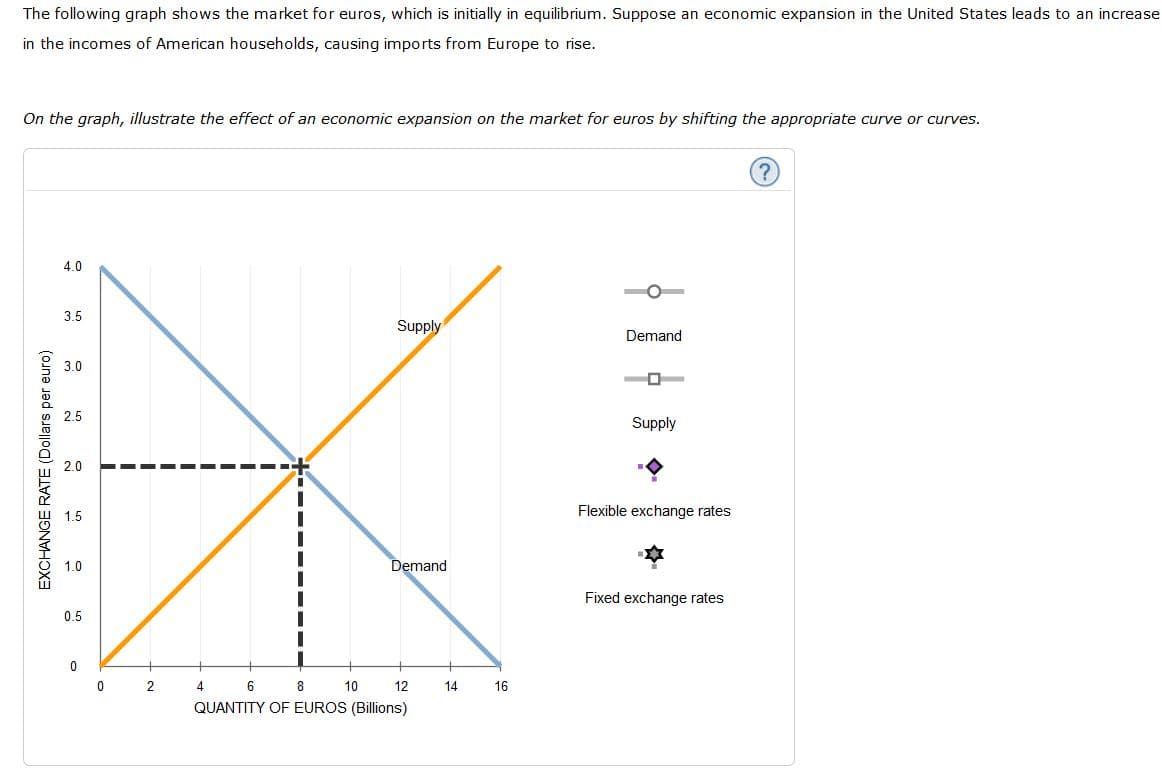
Transcribed Image Text:The following graph shows the market for euros, which is initially in equilibrium. Suppose an economic expansion in the United States leads to an increase
in the incomes of American households, causing imports from Europe to rise.
On the graph, illustrate the effect of an economic expansion on the market for euros by shifting the appropriate curve or curves.
4.0
3.5
Supply
Demand
3.0
2.5
Supply
2.0
Flexible exchange rates
1.5
1.0
Demand
Fixed exchange rates
0.5
2
6
8.
10
12
14
16
QUANTITY OF EUROS (Billions)
EXCHANGE RATE (Dollars per euro)
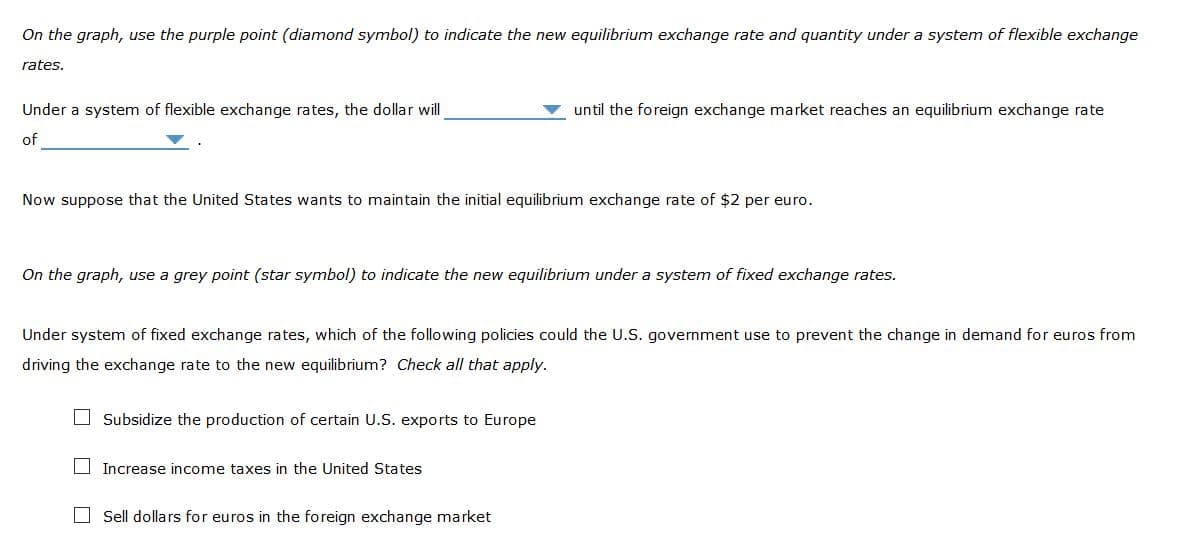
Transcribed Image Text:On the graph, use the purple point (diamond symbol) to indicate the new equilibrium exchange rate and quantity under a system of flexible exchange
rates.
Under a system of flexible exchange rates, the dollar will
until the foreign exchange market reaches an equilibrium exchange rate
of
Now suppose that the United States wants to maintain the initial equilibrium exchange rate of $2 per euro.
On the graph, use a grey point (star symbol) to indicate the new equilibrium under a system of fixed exchange rates.
Under system of fixed exchange rates, which of the following policies could the U.S. government use to prevent the change in demand for euros from
driving the exchange rate to the new equilibrium? Check all that apply.
O Subsidize the production of certain U.S. exports to Europe
O Increase income taxes in the United States
O Sell dollars for euros in the foreign exchange market
Expert Solution
This question has been solved!
Explore an expertly crafted, step-by-step solution for a thorough understanding of key concepts.

This is a popular solution!

Trending now
This is a popular solution!

Step by step
Solved in 3 steps with 1 images

Knowledge Booster


Learn more about
Need a deep-dive on the concept behind this application? Look no further. Learn more about this topic, economics and related others by exploring similar questions and additional content below.Recommended textbooks for you


Principles of Economics 2e
Economics
ISBN:
9781947172364
Author:
Steven A. Greenlaw; David Shapiro
Publisher:
OpenStax

Exploring Economics
Economics
ISBN:
9781544336329
Author:
Robert L. Sexton
Publisher:
SAGE Publications, Inc