The following graph shows the market for loanable funds in a closed economy. The upward-sloping orange line represents the supply of loanable funds, and the downward-sloping blue line represents the demand for loanable funds. (Graph in image) (a. Saving, b. Investment) is the source of the supply of loanable funds. As the interest rate falls, the quantity of loanable funds supplied (a. increases, b. decreases). Suppose the interest rate is 4.5%. Based on the previous graph, the quantity of loanable funds supplied is (a. greater, b. less) than the quantity of loans demanded, resulting in a (a. surplus, b. shortage) of loanable funds. This would encourage lenders to (a. raise, b. lower) the interest rates they charge, thereby (a. increasing, b. decreasing) the quantity of loanable funds supplied and (a. increasing, b. decreasing) the quantity of loanable funds demanded, moving the market toward the equilibrium interest rate of ____ %.
The following graph shows the market for loanable funds in a closed economy. The upward-sloping orange line represents the supply of loanable funds, and the downward-sloping blue line represents the demand for loanable funds. (Graph in image) (a. Saving, b. Investment) is the source of the supply of loanable funds. As the interest rate falls, the quantity of loanable funds supplied (a. increases, b. decreases). Suppose the interest rate is 4.5%. Based on the previous graph, the quantity of loanable funds supplied is (a. greater, b. less) than the quantity of loans demanded, resulting in a (a. surplus, b. shortage) of loanable funds. This would encourage lenders to (a. raise, b. lower) the interest rates they charge, thereby (a. increasing, b. decreasing) the quantity of loanable funds supplied and (a. increasing, b. decreasing) the quantity of loanable funds demanded, moving the market toward the equilibrium interest rate of ____ %.

Chapter21: Financial Markets, Saving, And Investment
Section: Chapter Questions
Problem 4P

Related questions
Question
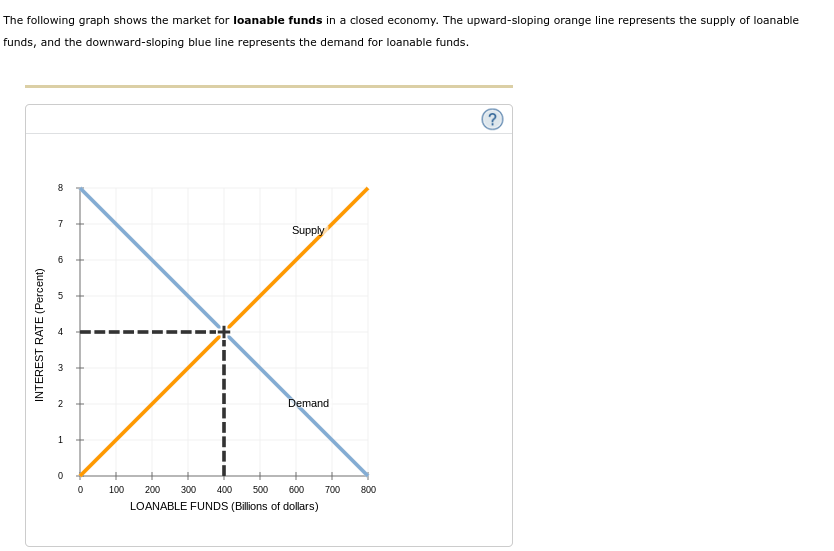
The following graph shows the market for loanable funds in a closed economy. The upward-sloping orange line represents the supply of loanable funds, and the downward-sloping blue line represents the demand for loanable funds.
(Graph in image)
(a. Saving, b. Investment) is the source of the supply of loanable funds. As the interest rate falls, the quantity of loanable funds supplied (a. increases, b. decreases).
Suppose the interest rate is 4.5%. Based on the previous graph, the quantity of loanable funds supplied is (a. greater, b. less) than the quantity of loans demanded, resulting in a (a. surplus, b. shortage) of loanable funds. This would encourage lenders to (a. raise, b. lower) the interest rates they charge, thereby (a. increasing, b. decreasing) the quantity of loanable funds supplied and (a. increasing, b. decreasing) the quantity of loanable funds demanded, moving the market toward the equilibrium interest rate of ____ %.
Transcribed Image Text:The following graph shows the market for loanable funds in a closed economy. The upward-sloping orange line represents the supply of loanable
funds, and the downward-sloping blue line represents the demand for loanable funds.
INTEREST RATE (Percent)
8
7
en
بنا
2
1
0
0
Supply
Demand
100 200 300 400 500 600
LOANABLE FUNDS (Billions of dollars)
700
800
Transcribed Image Text:is the source of the supply of loanable funds. As the interest rate falls, the quantity of loanable funds supplied
Suppose the interest rate is 4.5%. Based on the previous graph, the quantity of loanable funds supplied is
demanded, resulting in a
of loanable funds. This would encourage lenders to
the quantity of loanable funds supplied and
the equilibrium interest rate of
%
than the quantity of loans
the interest rates they charge, thereby
the quantity of loanable funds demanded, moving the market toward
Expert Solution
This question has been solved!
Explore an expertly crafted, step-by-step solution for a thorough understanding of key concepts.

This is a popular solution!

Trending now
This is a popular solution!

Step by step
Solved in 2 steps with 2 images

Knowledge Booster


Learn more about
Need a deep-dive on the concept behind this application? Look no further. Learn more about this topic, economics and related others by exploring similar questions and additional content below.Recommended textbooks for you
Exploring Economics
Economics
ISBN:
9781544336329
Author:
Robert L. Sexton
Publisher:
SAGE Publications, Inc

Brief Principles of Macroeconomics (MindTap Cours…
Economics
ISBN:
9781337091985
Author:
N. Gregory Mankiw
Publisher:
Cengage Learning

Essentials of Economics (MindTap Course List)
Economics
ISBN:
9781337091992
Author:
N. Gregory Mankiw
Publisher:
Cengage Learning
Exploring Economics
Economics
ISBN:
9781544336329
Author:
Robert L. Sexton
Publisher:
SAGE Publications, Inc
Brief Principles of Macroeconomics (MindTap Cours…
Economics
ISBN:
9781337091985
Author:
N. Gregory Mankiw
Publisher:
Cengage Learning
Essentials of Economics (MindTap Course List)
Economics
ISBN:
9781337091992
Author:
N. Gregory Mankiw
Publisher:
Cengage Learning

Macroeconomics: Private and Public Choice (MindTa…
Economics
ISBN:
9781305506756
Author:
James D. Gwartney, Richard L. Stroup, Russell S. Sobel, David A. Macpherson
Publisher:
Cengage Learning

Economics: Private and Public Choice (MindTap Cou…
Economics
ISBN:
9781305506725
Author:
James D. Gwartney, Richard L. Stroup, Russell S. Sobel, David A. Macpherson
Publisher:
Cengage Learning

Microeconomics: Private and Public Choice (MindTa…
Economics
ISBN:
9781305506893
Author:
James D. Gwartney, Richard L. Stroup, Russell S. Sobel, David A. Macpherson
Publisher:
Cengage Learning