The following is a list of P/E ratios (current stock price divided by company's earnings per share) for 16 companies. 57, 53, 50, 46, 42, 35, 31, 56, 52, 49, 34, 34, 34, 30, 30, 30 Send data to calculator Draw the histogram for these data using an initial class boundary of 29.5 a class width of 6. Note that you can add or remove classes from the figu Label each class with its endpoints. Frequency
The following is a list of P/E ratios (current stock price divided by company's earnings per share) for 16 companies. 57, 53, 50, 46, 42, 35, 31, 56, 52, 49, 34, 34, 34, 30, 30, 30 Send data to calculator Draw the histogram for these data using an initial class boundary of 29.5 a class width of 6. Note that you can add or remove classes from the figu Label each class with its endpoints. Frequency

Glencoe Algebra 1, Student Edition, 9780079039897, 0079039898, 2018
18th Edition
ISBN:9780079039897
Author:Carter
Publisher:Carter
Chapter10: Statistics
Section10.3: Measures Of Spread
Problem 22PFA

Related questions
Question
Transcribed Image Text:O DESCRIPTIVE STATISTICS
Shasia
Histograms for grouped data
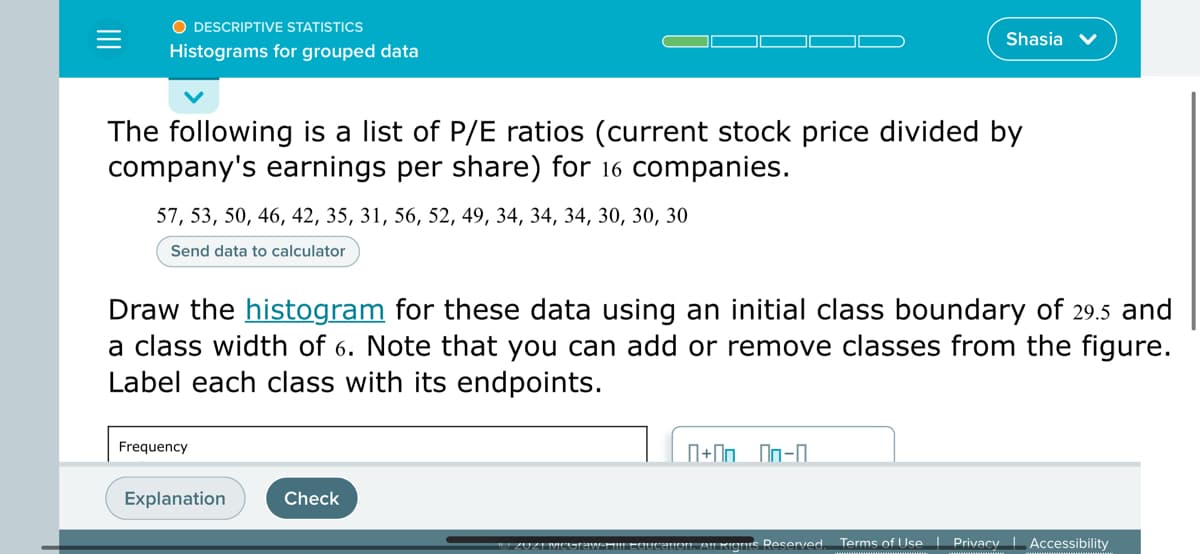
The following is a list of P/E ratios (current stock price divided by
company's earnings per share) for 16 companies.
57, 53, 50, 46, 42, 35, 31, 56, 52, 49, 34, 34, 34, 30, 30, 30
Send data to calculator
Draw the histogram for these data using an initial class boundary of 29.5 and
a class width of 6. Note that you can add or remove classes from the figure.
Label each class with its endpoints.
Frequency
Explanation
Check
n AL KIGS Resenved Terms of Use Privacy Accessibility
Transcribed Image Text:O DESCRIPTIVE STATISTICS
Shasia v
Histograms for grouped data
nd
а сrа
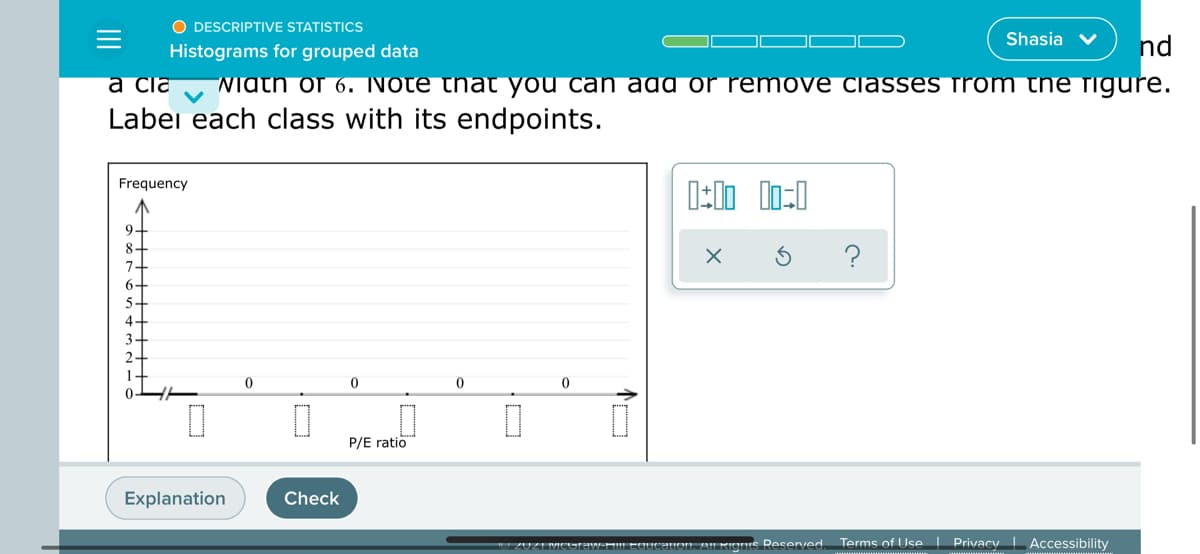
Niath of 6. Note that you can add or remove classes from the figure.
Labei each class with its endpoints.
Frequency
9-
8+
7+
6+
?
4-
3-
2-
P/E ratio
Explanation
Check
AIas Resenved Terms of Use Privacy Accessibility
Expert Solution
Step 1
It is an important part of statistics . It is widely used .

Trending now
This is a popular solution!

Step by step
Solved in 2 steps with 1 images

Knowledge Booster


Learn more about
Need a deep-dive on the concept behind this application? Look no further. Learn more about this topic, statistics and related others by exploring similar questions and additional content below.Recommended textbooks for you
Glencoe Algebra 1, Student Edition, 9780079039897…
Algebra
ISBN:
9780079039897
Author:
Carter
Publisher:
McGraw Hill
Glencoe Algebra 1, Student Edition, 9780079039897…
Algebra
ISBN:
9780079039897
Author:
Carter
Publisher:
McGraw Hill