The following MINITAB output presents the results of a hypothesis test for the difference Hx - Hy between two population means. Paired T for X - Y Mean StDev SE Mean 12 134.233 68.376 19.739 12 100.601 94.583 27.304 Difference 12 33.6316 59.5113 17.1794 95% lower bound for mean difference: 2.7793 T-Test of mean difference = 0 (vs > 0): T-Value = 1.96 P-Value = 0.038 Is this a one-tailed or two-tailed test? What is the null hypothesis? Can H, be rejected at the 1% level? How can you tell? a. b. C. d. Use the output and an appropriate table to compute a 98% confidence interval for µx Hy.
The following MINITAB output presents the results of a hypothesis test for the difference Hx - Hy between two population means. Paired T for X - Y Mean StDev SE Mean 12 134.233 68.376 19.739 12 100.601 94.583 27.304 Difference 12 33.6316 59.5113 17.1794 95% lower bound for mean difference: 2.7793 T-Test of mean difference = 0 (vs > 0): T-Value = 1.96 P-Value = 0.038 Is this a one-tailed or two-tailed test? What is the null hypothesis? Can H, be rejected at the 1% level? How can you tell? a. b. C. d. Use the output and an appropriate table to compute a 98% confidence interval for µx Hy.

MATLAB: An Introduction with Applications
6th Edition
ISBN:9781119256830
Author:Amos Gilat
Publisher:Amos Gilat
Chapter1: Starting With Matlab
Section: Chapter Questions
Problem 1P

Related questions
Question
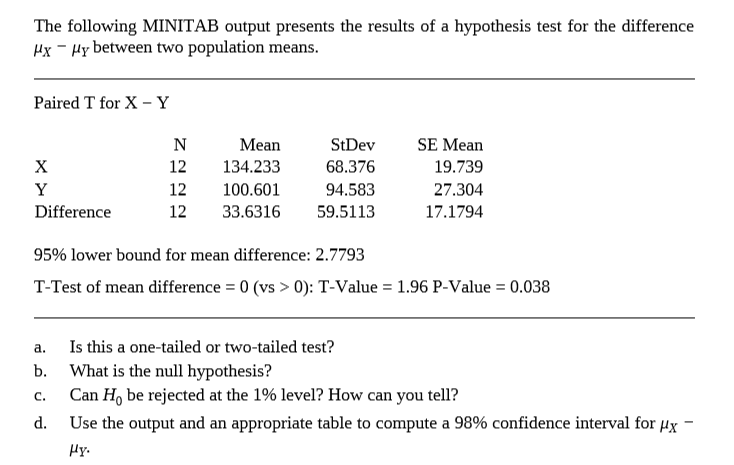
Transcribed Image Text:The following MINITAB output presents the results of a hypothesis test for the difference
Hx - Hy between two population means.
Paired T for X - Y
Mean
StDev
SE Mean
12
134.233
68.376
19.739
12
100.601
94.583
27.304
Difference
12
33.6316
59.5113
17.1794
95% lower bound for mean difference: 2.7793
T-Test of mean difference = 0 (vs > 0): T-Value = 1.96 P-Value = 0.038
Is this a one-tailed or two-tailed test?
What is the null hypothesis?
Can H, be rejected at the 1% level? How can you tell?
a.
b.
C.
d.
Use the output and an appropriate table to compute a 98% confidence interval for µx
Hy.
Expert Solution
This question has been solved!
Explore an expertly crafted, step-by-step solution for a thorough understanding of key concepts.

This is a popular solution!

Trending now
This is a popular solution!

Step by step
Solved in 3 steps

Recommended textbooks for you
MATLAB: An Introduction with Applications
Statistics
ISBN:
9781119256830
Author:
Amos Gilat
Publisher:
John Wiley & Sons Inc

Probability and Statistics for Engineering and th…
Statistics
ISBN:
9781305251809
Author:
Jay L. Devore
Publisher:
Cengage Learning

Statistics for The Behavioral Sciences (MindTap C…
Statistics
ISBN:
9781305504912
Author:
Frederick J Gravetter, Larry B. Wallnau
Publisher:
Cengage Learning
MATLAB: An Introduction with Applications
Statistics
ISBN:
9781119256830
Author:
Amos Gilat
Publisher:
John Wiley & Sons Inc
Probability and Statistics for Engineering and th…
Statistics
ISBN:
9781305251809
Author:
Jay L. Devore
Publisher:
Cengage Learning
Statistics for The Behavioral Sciences (MindTap C…
Statistics
ISBN:
9781305504912
Author:
Frederick J Gravetter, Larry B. Wallnau
Publisher:
Cengage Learning

Elementary Statistics: Picturing the World (7th E…
Statistics
ISBN:
9780134683416
Author:
Ron Larson, Betsy Farber
Publisher:
PEARSON

The Basic Practice of Statistics
Statistics
ISBN:
9781319042578
Author:
David S. Moore, William I. Notz, Michael A. Fligner
Publisher:
W. H. Freeman

Introduction to the Practice of Statistics
Statistics
ISBN:
9781319013387
Author:
David S. Moore, George P. McCabe, Bruce A. Craig
Publisher:
W. H. Freeman