The following MINITAB output presents the results of a hypothesis test for the difference P1- P2 between two population proportions. Test and CI for Two Proportions Sample х N Sample p 41 97 0.422680 2 37 61 0.606557 Difference = p (1) – p (2) Estimate for difference: -0.183877 95% CI for difference: (-0.341016, -0.026738) Test for difference = 0 (vs not = 0): Z = -2.25 P-Value = 0.024 %3D %3D Is this a one-tailed or two-tailed test? a. b. What is the null hypothesis? Can Họ be rejected at the 5% level? How can you tell? C.
The following MINITAB output presents the results of a hypothesis test for the difference P1- P2 between two population proportions. Test and CI for Two Proportions Sample х N Sample p 41 97 0.422680 2 37 61 0.606557 Difference = p (1) – p (2) Estimate for difference: -0.183877 95% CI for difference: (-0.341016, -0.026738) Test for difference = 0 (vs not = 0): Z = -2.25 P-Value = 0.024 %3D %3D Is this a one-tailed or two-tailed test? a. b. What is the null hypothesis? Can Họ be rejected at the 5% level? How can you tell? C.

Holt Mcdougal Larson Pre-algebra: Student Edition 2012
1st Edition
ISBN:9780547587776
Author:HOLT MCDOUGAL
Publisher:HOLT MCDOUGAL
Chapter11: Data Analysis And Probability
Section: Chapter Questions
Problem 8CR

Related questions
Question
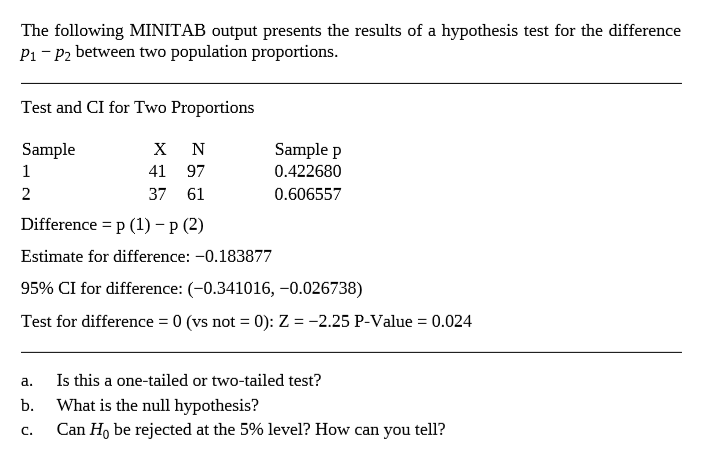
Transcribed Image Text:The following MINITAB output presents the results of a hypothesis test for the difference
P1- P2 between two population proportions.
Test and CI for Two Proportions
Sample
х N
Sample p
41 97
0.422680
2
37 61
0.606557
Difference = p (1) – p (2)
Estimate for difference: -0.183877
95% CI for difference: (-0.341016, -0.026738)
Test for difference = 0 (vs not = 0): Z = -2.25 P-Value = 0.024
%3D
%3D
Is this a one-tailed or two-tailed test?
a.
b.
What is the null hypothesis?
Can Họ be rejected at the 5% level? How can you tell?
C.
Expert Solution
This question has been solved!
Explore an expertly crafted, step-by-step solution for a thorough understanding of key concepts.

This is a popular solution!

Trending now
This is a popular solution!

Step by step
Solved in 3 steps

Recommended textbooks for you
Holt Mcdougal Larson Pre-algebra: Student Edition…
Algebra
ISBN:
9780547587776
Author:
HOLT MCDOUGAL
Publisher:
HOLT MCDOUGAL
Holt Mcdougal Larson Pre-algebra: Student Edition…
Algebra
ISBN:
9780547587776
Author:
HOLT MCDOUGAL
Publisher:
HOLT MCDOUGAL