The following printout shows the results of a simple linear regression model that predicts monthly sales (in thousands of dollars) based on how much money was spent on advertising (in thousands of dollars) during a particular month for 15 stores of a retail chain. a) Is there a statistically significant relationship between money spent on advertising and sales? Test at the 5% level of significance and explain your approach (including hypotheses). b) Somebody claims that every additional $1,000 in advertising will increase sales by more than $2,000 in the population. Can you find support for this claim given the results of your analysis? Test at the 5% level of significance and explain your approach (including hypotheses). How is this test different from the one in part a)? c) Find a 95% confidence interval for the change in sales given a $1,000 increase in the amount of money spent on advertising. How does this confidence interval relate to your answer to part a)?


Problem 2
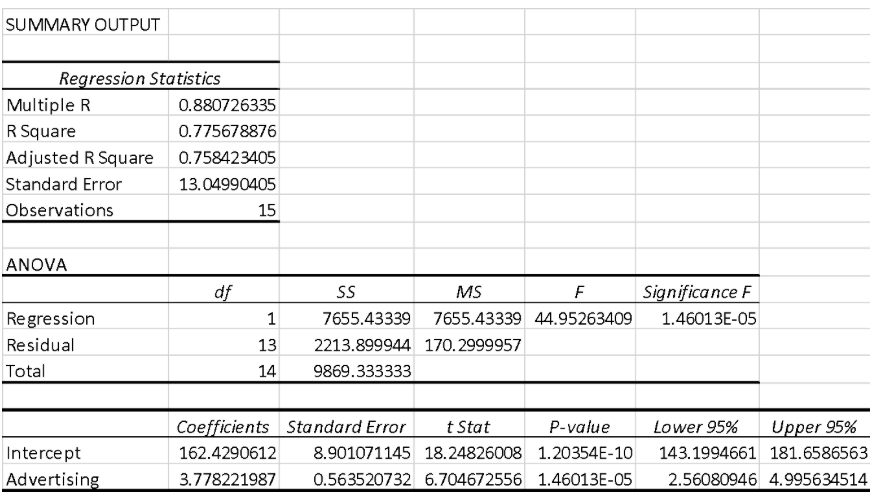
The following printout shows the results of a simple linear regression model that predicts monthly sales (in thousands of dollars) based on how much money was spent on advertising (in thousands of dollars) during a particular month for 15 stores of a retail chain.
a) Is there a statistically significant relationship between money spent on advertising and sales? Test at the 5% level of significance and explain your approach (including hypotheses).
b) Somebody claims that every additional $1,000 in advertising will increase sales by more than $2,000 in the population. Can you find support for this claim given the results of your analysis? Test at the 5% level of significance and explain your approach (including hypotheses). How is this test different from the one in part a)?
c) Find a 95% confidence interval for the change in sales given a $1,000 increase in the amount of money spent on advertising. How does this confidence interval relate to your answer to part a)?


Trending now
This is a popular solution!

Step by step
Solved in 6 steps with 4 images

