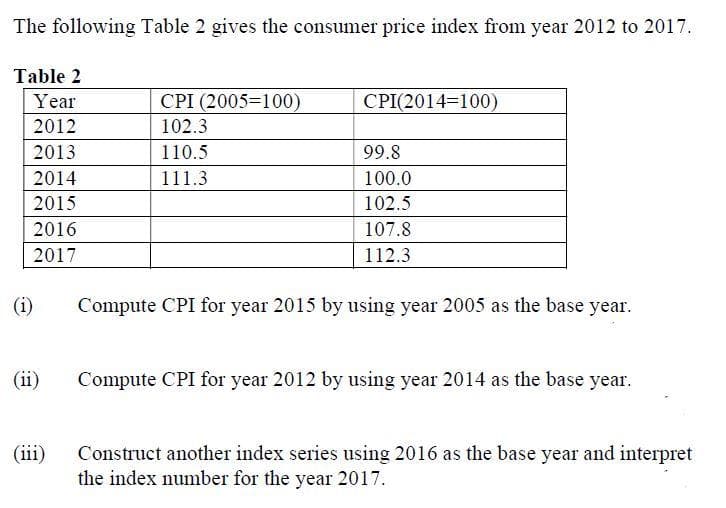
The following Table 2 gives the consumer price index from year 2012 to 2017. Table 2 Year CPI (2005=100) CPI(2014=100) 2012 102.3 2013 110.5 99.8 2014 111.3 100.0 2015 102.5 2016 107.8 2017 112.3 (i) Compute CPI for year 2015 by using year 2005 as the base year. (ii) Compute CPI for year 2012 by using year 2014 as the base year. Construct another index series using 2016 as the base year and interpret the index number for the year 2017. (iii)
The following Table 2 gives the consumer price index from year 2012 to 2017. Table 2 Year CPI (2005=100) CPI(2014=100) 2012 102.3 2013 110.5 99.8 2014 111.3 100.0 2015 102.5 2016 107.8 2017 112.3 (i) Compute CPI for year 2015 by using year 2005 as the base year. (ii) Compute CPI for year 2012 by using year 2014 as the base year. Construct another index series using 2016 as the base year and interpret the index number for the year 2017. (iii)

Chapter7: Unemployment And Inflation
Section: Chapter Questions
Problem 3.7P

Related questions
Question
Economic
Transcribed Image Text:The following Table 2 gives the consumer price index from year 2012 to 2017.
Table 2
Year
CPI (2005=100)
CPI(2014=100)
2012
102.3
2013
110.5
99.8
2014
111.3
100.0
2015
102.5
2016
107.8
2017
112.3
(i)
Compute CPI for year 2015 by using year 2005 as the base year.
(ii)
Compute CPI for year 2012 by using year 2014 as the base year.
Construct another index series using 2016 as the base year and interpret
the index number for the year 2017.
(iii)
Expert Solution
This question has been solved!
Explore an expertly crafted, step-by-step solution for a thorough understanding of key concepts.

This is a popular solution!

Trending now
This is a popular solution!

Step by step
Solved in 3 steps

Knowledge Booster


Learn more about
Need a deep-dive on the concept behind this application? Look no further. Learn more about this topic, economics and related others by exploring similar questions and additional content below.Recommended textbooks for you


Economics (MindTap Course List)
Economics
ISBN:
9781337617383
Author:
Roger A. Arnold
Publisher:
Cengage Learning
