The following table contains the number of successes and failures for three categories of a variable. Test whether the proportions are equal for each category at the a = 0.01 level of significance. Category 1 Category 2 Category 3 O Failures 59 54 81 Successes 43 62 29 Click the icon to view the Chi-Square table of critical values. State the hypotheses. Choose the correct answer below. O A. Ho: P1 = P2 = P3 H,: At least one of the proportions is different from the others. O B. Ho: The categories of the variable and success and failure are dependent. H1: The categories of the variable and success and failure are independent. O C. Ho: H1 = E, and µ2 = E2 and µ3 = E3 H1: At least one mean is different from what is expected. %3D %3D O D. Ho: The categories of the variable and success and failure are independent. H7: : The categories of the variable and success and failure are dependent. Compute the value of the chi-square test statistic. (Round to three decimal places as needed.) What range of P-values does the test statistic correspond to? The P-value is What conclusion can be made? O A. The P-value is less than a, so reject Ho. There is sufficient evidence that the proportions are different from each other. B. The P-value is less than a, so do not reject Ho. There is not sufficient evidence that the categories of the variable and success and failure are dependent. O C. The P-value is greater than or equal to a, so do not reject Ho. There is sufficient evidence that the categories of the variable and success and failure are dependent. O D. The P-value is greater than or equal to ɑ, so reject Ho. There is not sufficient evidence that the proportions are different from each other.
The following table contains the number of successes and failures for three categories of a variable. Test whether the proportions are equal for each category at the a = 0.01 level of significance. Category 1 Category 2 Category 3 O Failures 59 54 81 Successes 43 62 29 Click the icon to view the Chi-Square table of critical values. State the hypotheses. Choose the correct answer below. O A. Ho: P1 = P2 = P3 H,: At least one of the proportions is different from the others. O B. Ho: The categories of the variable and success and failure are dependent. H1: The categories of the variable and success and failure are independent. O C. Ho: H1 = E, and µ2 = E2 and µ3 = E3 H1: At least one mean is different from what is expected. %3D %3D O D. Ho: The categories of the variable and success and failure are independent. H7: : The categories of the variable and success and failure are dependent. Compute the value of the chi-square test statistic. (Round to three decimal places as needed.) What range of P-values does the test statistic correspond to? The P-value is What conclusion can be made? O A. The P-value is less than a, so reject Ho. There is sufficient evidence that the proportions are different from each other. B. The P-value is less than a, so do not reject Ho. There is not sufficient evidence that the categories of the variable and success and failure are dependent. O C. The P-value is greater than or equal to a, so do not reject Ho. There is sufficient evidence that the categories of the variable and success and failure are dependent. O D. The P-value is greater than or equal to ɑ, so reject Ho. There is not sufficient evidence that the proportions are different from each other.

MATLAB: An Introduction with Applications
6th Edition
ISBN:9781119256830
Author:Amos Gilat
Publisher:Amos Gilat
Chapter1: Starting With Matlab
Section: Chapter Questions
Problem 1P

Related questions

Question
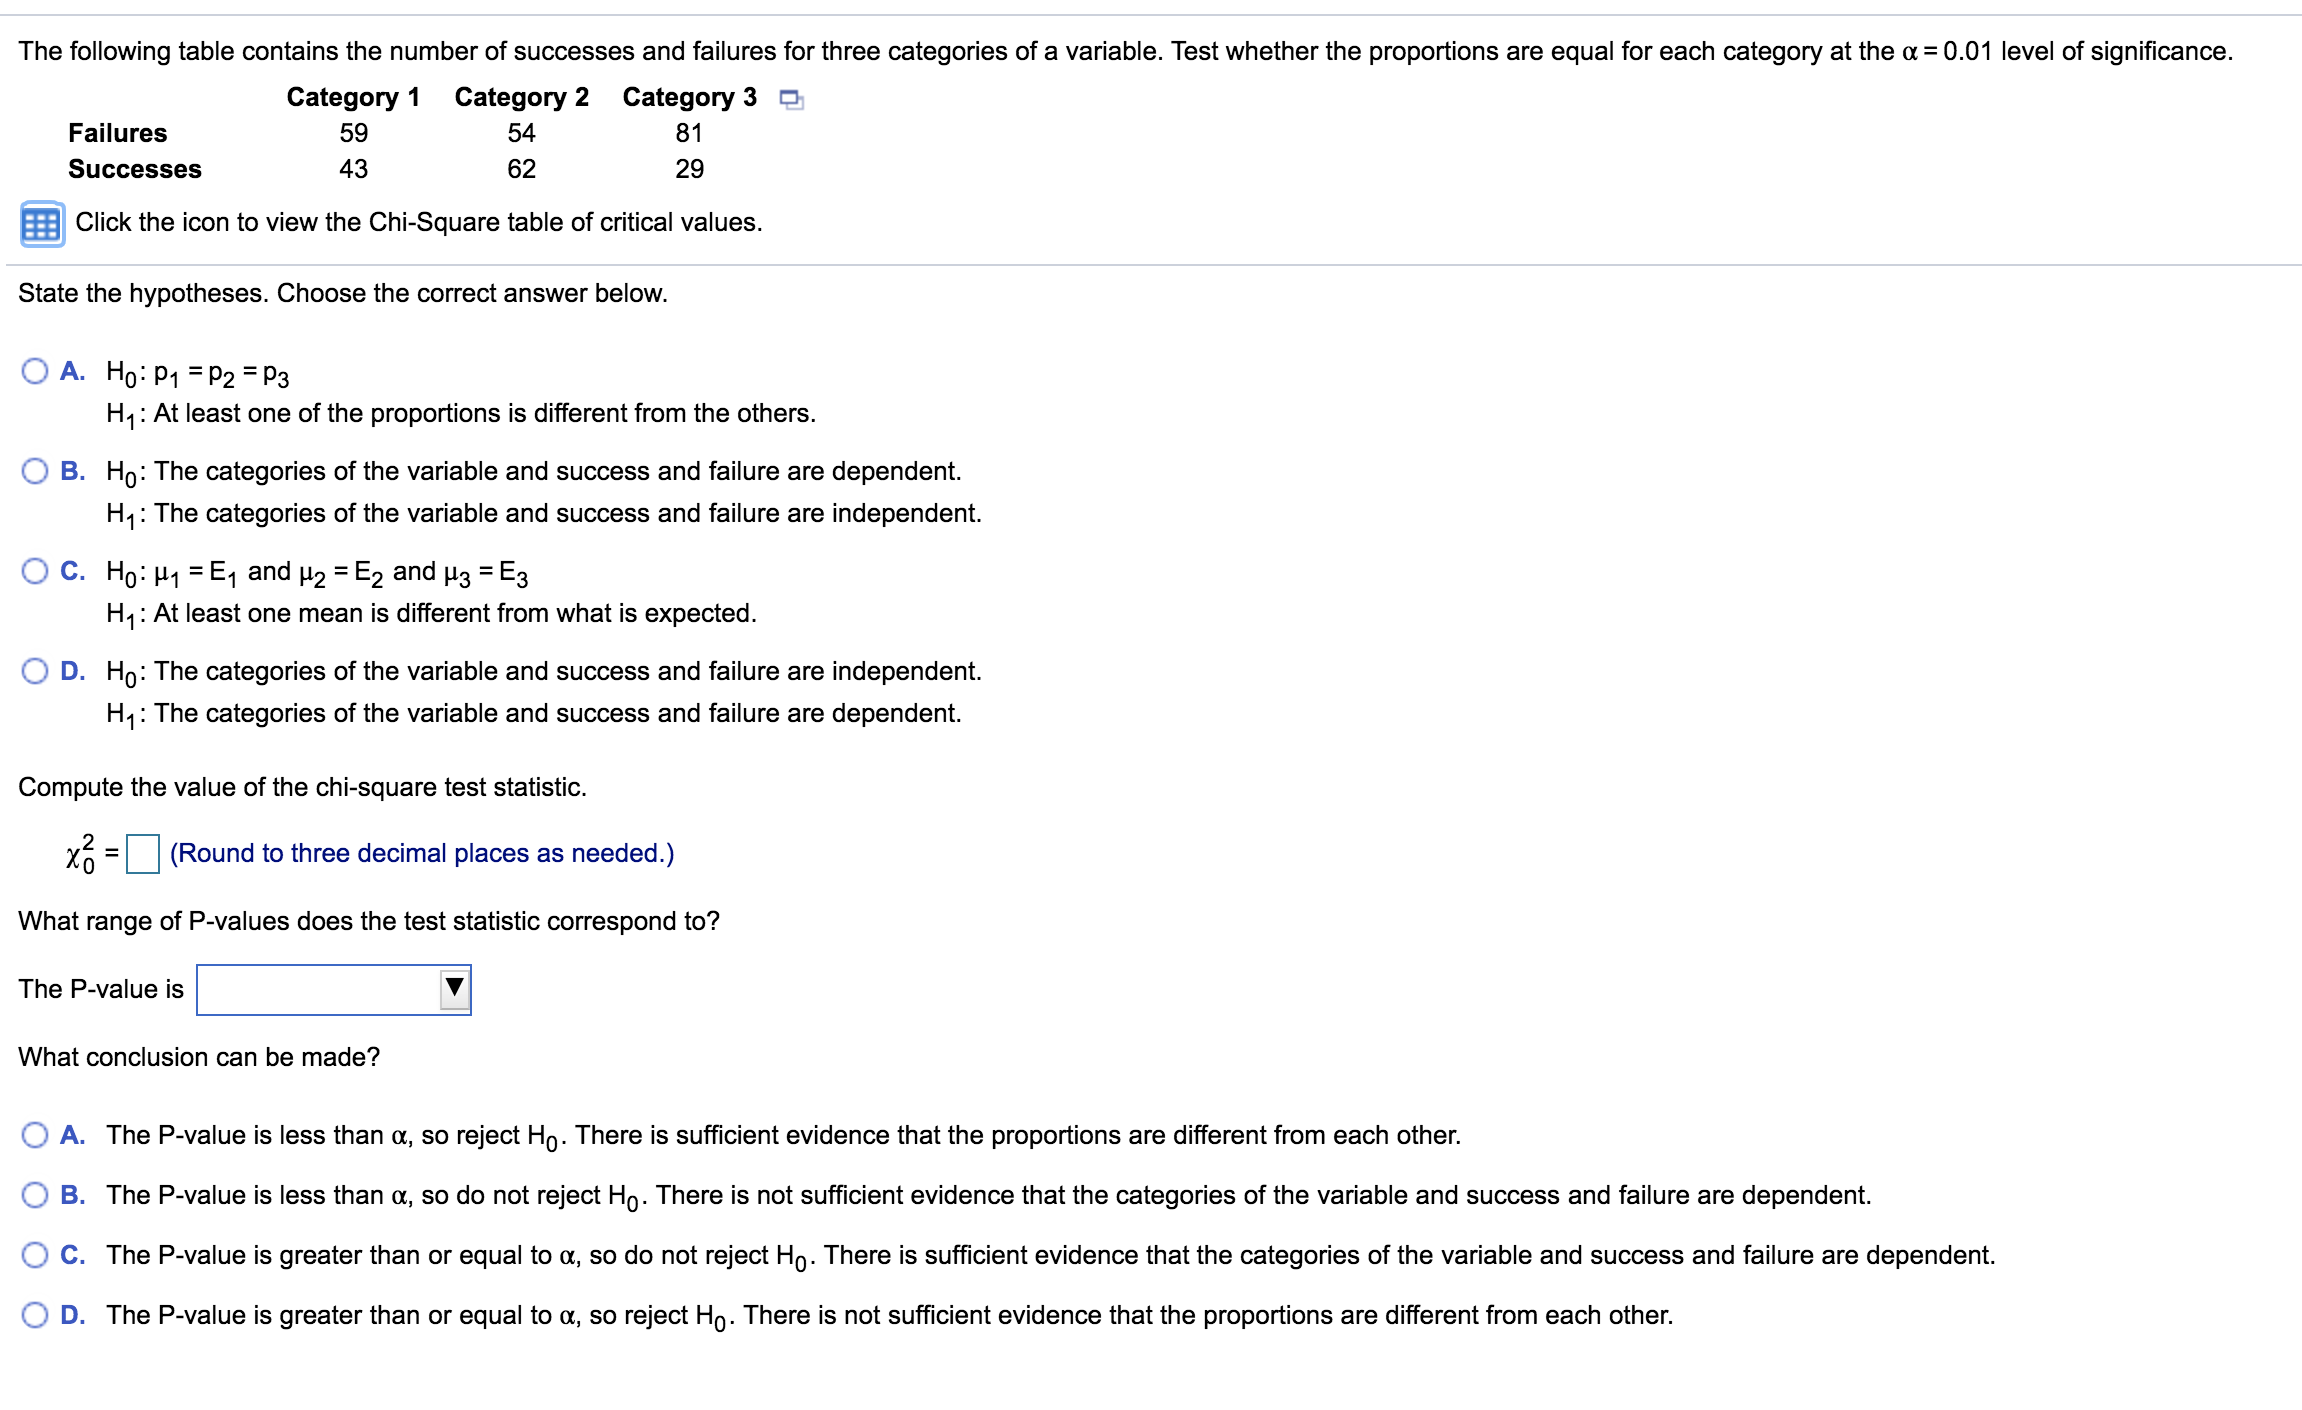
Transcribed Image Text:The following table contains the number of successes and failures for three categories of a variable. Test whether the proportions are equal for each category at the a = 0.01 level of significance.
Category 1
Category 2
Category 3 O
Failures
59
54
81
Successes
43
62
29
Click the icon to view the Chi-Square table of critical values.
State the hypotheses. Choose the correct answer below.
O A. Ho: P1 = P2 = P3
H,: At least one of the proportions is different from the others.
O B. Ho: The categories of the variable and success and failure are dependent.
H1: The categories of the variable and success and failure are independent.
O C. Ho: H1 = E, and µ2 = E2 and µ3 = E3
H1: At least one mean is different from what is expected.
%3D
%3D
O D. Ho: The categories of the variable and success and failure are independent.
H7:
: The categories of the variable and success and failure are dependent.
Compute the value of the chi-square test statistic.
(Round to three decimal places as needed.)
What range of P-values does the test statistic correspond to?
The P-value is
What conclusion can be made?
O A. The P-value is less than a, so reject Ho. There is sufficient evidence that the proportions are different from each other.
B. The P-value is less than a, so do not reject Ho. There is not sufficient evidence that the categories of the variable and success and failure are dependent.
O C. The P-value is greater than or equal to a, so do not reject Ho. There is sufficient evidence that the categories of the variable and success and failure are dependent.
O D. The P-value is greater than or equal to ɑ, so reject Ho. There is not sufficient evidence that the proportions are different from each other.
Expert Solution
This question has been solved!
Explore an expertly crafted, step-by-step solution for a thorough understanding of key concepts.

This is a popular solution!

Trending now
This is a popular solution!

Step by step
Solved in 3 steps with 5 images

Knowledge Booster


Learn more about
Need a deep-dive on the concept behind this application? Look no further. Learn more about this topic, statistics and related others by exploring similar questions and additional content below.Recommended textbooks for you
MATLAB: An Introduction with Applications
Statistics
ISBN:
9781119256830
Author:
Amos Gilat
Publisher:
John Wiley & Sons Inc

Probability and Statistics for Engineering and th…
Statistics
ISBN:
9781305251809
Author:
Jay L. Devore
Publisher:
Cengage Learning

Statistics for The Behavioral Sciences (MindTap C…
Statistics
ISBN:
9781305504912
Author:
Frederick J Gravetter, Larry B. Wallnau
Publisher:
Cengage Learning
MATLAB: An Introduction with Applications
Statistics
ISBN:
9781119256830
Author:
Amos Gilat
Publisher:
John Wiley & Sons Inc
Probability and Statistics for Engineering and th…
Statistics
ISBN:
9781305251809
Author:
Jay L. Devore
Publisher:
Cengage Learning
Statistics for The Behavioral Sciences (MindTap C…
Statistics
ISBN:
9781305504912
Author:
Frederick J Gravetter, Larry B. Wallnau
Publisher:
Cengage Learning

Elementary Statistics: Picturing the World (7th E…
Statistics
ISBN:
9780134683416
Author:
Ron Larson, Betsy Farber
Publisher:
PEARSON

The Basic Practice of Statistics
Statistics
ISBN:
9781319042578
Author:
David S. Moore, William I. Notz, Michael A. Fligner
Publisher:
W. H. Freeman

Introduction to the Practice of Statistics
Statistics
ISBN:
9781319013387
Author:
David S. Moore, George P. McCabe, Bruce A. Craig
Publisher:
W. H. Freeman