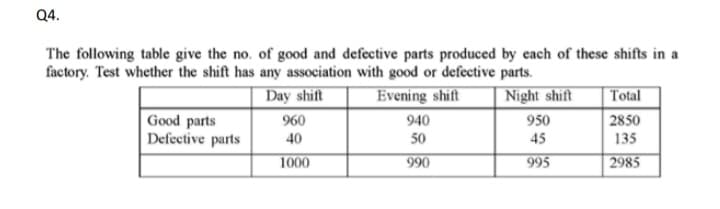
The following table give the no. of good and defective parts produced by each of these shifts in a factory. Test whether the shift has any association with good or defective parts. Night shift Day shift Evening shift Total Good parts Defective parts 960 940 2850 950 45 40 50 135 1000 990 995 2985
The following table give the no. of good and defective parts produced by each of these shifts in a factory. Test whether the shift has any association with good or defective parts. Night shift Day shift Evening shift Total Good parts Defective parts 960 940 2850 950 45 40 50 135 1000 990 995 2985

Glencoe Algebra 1, Student Edition, 9780079039897, 0079039898, 2018
18th Edition
ISBN:9780079039897
Author:Carter
Publisher:Carter
Chapter10: Statistics
Section10.6: Summarizing Categorical Data
Problem 27PPS

Related questions
Question
Transcribed Image Text:Q4.
The following table give the no. of good and defective parts produced by each of these shifts in a
factory. Test whether the shift has any association with good or defective parts.
Day shift
Evening shift
Night shift
Total
Good parts
Defective parts
960
940
950
2850
40
50
45
135
1000
990
995
2985
Expert Solution
This question has been solved!
Explore an expertly crafted, step-by-step solution for a thorough understanding of key concepts.

This is a popular solution!

Trending now
This is a popular solution!

Step by step
Solved in 3 steps with 2 images

Knowledge Booster


Learn more about
Need a deep-dive on the concept behind this application? Look no further. Learn more about this topic, statistics and related others by exploring similar questions and additional content below.Recommended textbooks for you
Glencoe Algebra 1, Student Edition, 9780079039897…
Algebra
ISBN:
9780079039897
Author:
Carter
Publisher:
McGraw Hill
Glencoe Algebra 1, Student Edition, 9780079039897…
Algebra
ISBN:
9780079039897
Author:
Carter
Publisher:
McGraw Hill