The following table shows some data for an economy that produces only two goods: milk and honey. Milk Honey Price Quantity Price Quantity Year (Dollars) (Quarts) (Dollars) (Quarts) 2016 1 200 100 2017 1 400 2 200 2018 2 400 200 The following table shows nominal GDP, real GDP, and the GDP deflator for each year listed. TTT Nominal GDP Real GDP Year (Dollars) (Dollars) GDP Deflator 2016 400 400 100 2017 800 800 100 2018 1,600 800 200 Compute the percentage change in nominal GDP, real GDP, and the GDP defiator in 2017 and 2018 from the preceding year Percentage Change In... Year Nominal GDP Real GDP 100% 100% GDP Deflator 0% 2017 100% 2018 0% 100%
The following table shows some data for an economy that produces only two goods: milk and honey. Milk Honey Price Quantity Price Quantity Year (Dollars) (Quarts) (Dollars) (Quarts) 2016 1 200 100 2017 1 400 2 200 2018 2 400 200 The following table shows nominal GDP, real GDP, and the GDP deflator for each year listed. TTT Nominal GDP Real GDP Year (Dollars) (Dollars) GDP Deflator 2016 400 400 100 2017 800 800 100 2018 1,600 800 200 Compute the percentage change in nominal GDP, real GDP, and the GDP defiator in 2017 and 2018 from the preceding year Percentage Change In... Year Nominal GDP Real GDP 100% 100% GDP Deflator 0% 2017 100% 2018 0% 100%

Chapter6: Systems Of Equations And Inequalities
Section: Chapter Questions
Problem 19RE

Related questions

Question
Please answer percentage changes.
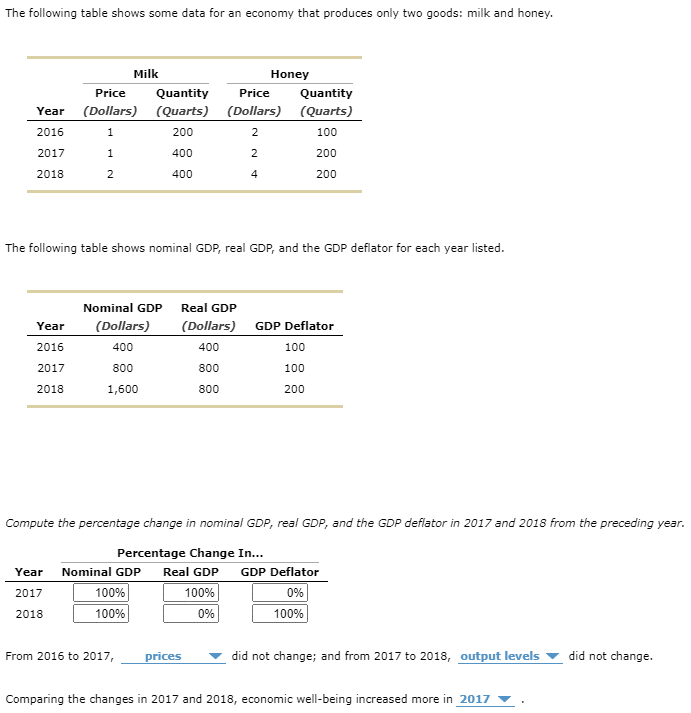
Transcribed Image Text:The following table shows some data for an economy that produces only two goods: milk and honey.
Milk
Honey
Price
Quantity
Price
Quantity
Year (Dollars) (Quarts) (Dollars) (Quarts)
2016
200
2
100
2017
400
2
200
2018
2
400
4
200
The following table shows nominal GDP, real GDP, and the GDP deflator for each year listed.
Nominal GDP Real GDP
Year
(Dollars)
(Dollars) GDP Deflator
2016
400
400
100
2017
800
800
100
2018
1,600
800
200
Compute the percentage change in nominal GDP, real GDP, and the GDP deflator in 2017 and 2018 from the preceding year.
Percentage Change In..
Year
Nominal GDP
Real GDP
GDP Deflator
100%
100%
2017
100%
0%
2018
0%
100%
From 2016 to 2017,
prices
did not change; and from 2017 to 2018, output levels
did not change.
Comparing the changes in 2017 and 2018, economic well-being increased more in 2017
Expert Solution
This question has been solved!
Explore an expertly crafted, step-by-step solution for a thorough understanding of key concepts.

This is a popular solution!

Trending now
This is a popular solution!

Step by step
Solved in 7 steps

Knowledge Booster


Learn more about
Need a deep-dive on the concept behind this application? Look no further. Learn more about this topic, statistics and related others by exploring similar questions and additional content below.Recommended textbooks for you

Linear Algebra: A Modern Introduction
Algebra
ISBN:
9781285463247
Author:
David Poole
Publisher:
Cengage Learning

College Algebra (MindTap Course List)
Algebra
ISBN:
9781305652231
Author:
R. David Gustafson, Jeff Hughes
Publisher:
Cengage Learning
Linear Algebra: A Modern Introduction
Algebra
ISBN:
9781285463247
Author:
David Poole
Publisher:
Cengage Learning
College Algebra (MindTap Course List)
Algebra
ISBN:
9781305652231
Author:
R. David Gustafson, Jeff Hughes
Publisher:
Cengage Learning

Algebra & Trigonometry with Analytic Geometry
Algebra
ISBN:
9781133382119
Author:
Swokowski
Publisher:
Cengage