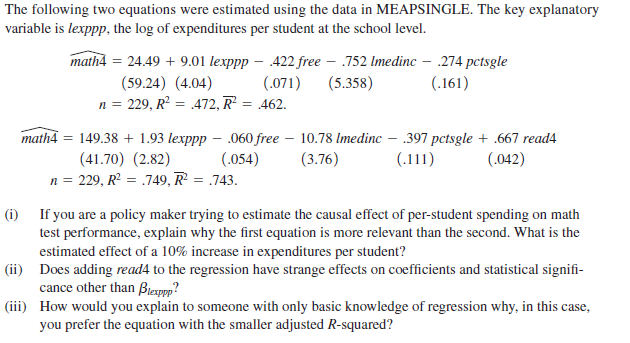
The following two equations were estimated using the data in MEAPSINGLE. The key explanatory variable is lexppp, the log of expenditures per student at the school level. math4 = 24.49 + 9.01 lexpp – 422 free – .752 Imedinc – .274 pctsgle (.071) (59.24) (4.04) n = 229, R² = .472, R² (5.358) (.161) 462. 149.38 + 1.93 lexppp – .060 free – 10.78 Imedinc – .397 pctsgle + .667 read4 (3.76) math4 (41.70) (2.82) (.054) (.111) (.042) n = 229, R = .749, R = .743. (i) If you are a policy maker trying to estimate the causal effect of per-student spending on math test performance, explain why the first equation is more relevant than the second. What is the estimated effect of a 10% increase in expenditures per student? (ii) Does adding read4 to the regression have strange effects on coefficients and statistical signifi- cance other than Brexppp? (iii) How would you explain to someone with only basic knowledge of regression why, in this case, you prefer the equation with the smaller adjusted R-squared?
The following two equations were estimated using the data in MEAPSINGLE. The key explanatory variable is lexppp, the log of expenditures per student at the school level. math4 = 24.49 + 9.01 lexpp – 422 free – .752 Imedinc – .274 pctsgle (.071) (59.24) (4.04) n = 229, R² = .472, R² (5.358) (.161) 462. 149.38 + 1.93 lexppp – .060 free – 10.78 Imedinc – .397 pctsgle + .667 read4 (3.76) math4 (41.70) (2.82) (.054) (.111) (.042) n = 229, R = .749, R = .743. (i) If you are a policy maker trying to estimate the causal effect of per-student spending on math test performance, explain why the first equation is more relevant than the second. What is the estimated effect of a 10% increase in expenditures per student? (ii) Does adding read4 to the regression have strange effects on coefficients and statistical signifi- cance other than Brexppp? (iii) How would you explain to someone with only basic knowledge of regression why, in this case, you prefer the equation with the smaller adjusted R-squared?

Managerial Economics: Applications, Strategies and Tactics (MindTap Course List)
14th Edition
ISBN:9781305506381
Author:James R. McGuigan, R. Charles Moyer, Frederick H.deB. Harris
Publisher:James R. McGuigan, R. Charles Moyer, Frederick H.deB. Harris
Chapter5: Business And Economic Forecasting
Section: Chapter Questions
Problem 1E: The forecasting staff for the Prizer Corporation has developed a model to predict sales of its...

Related questions
Question
Transcribed Image Text:The following two equations were estimated using the data in MEAPSINGLE. The key explanatory
variable is lexppp, the log of expenditures per student at the school level.
math4 = 24.49 + 9.01 lexpp – 422 free – .752 Imedinc – .274 pctsgle
(.071)
(59.24) (4.04)
n = 229, R² = .472, R²
(5.358)
(.161)
462.
149.38 + 1.93 lexppp – .060 free – 10.78 Imedinc – .397 pctsgle + .667 read4
(3.76)
math4
(41.70) (2.82)
(.054)
(.111)
(.042)
n = 229, R = .749, R = .743.
(i) If you are a policy maker trying to estimate the causal effect of per-student spending on math
test performance, explain why the first equation is more relevant than the second. What is the
estimated effect of a 10% increase in expenditures per student?
(ii) Does adding read4 to the regression have strange effects on coefficients and statistical signifi-
cance other than Brexppp?
(iii) How would you explain to someone with only basic knowledge of regression why, in this case,
you prefer the equation with the smaller adjusted R-squared?
Expert Solution
This question has been solved!
Explore an expertly crafted, step-by-step solution for a thorough understanding of key concepts.

This is a popular solution!

Trending now
This is a popular solution!

Step by step
Solved in 2 steps

Recommended textbooks for you
Managerial Economics: Applications, Strategies an…
Economics
ISBN:
9781305506381
Author:
James R. McGuigan, R. Charles Moyer, Frederick H.deB. Harris
Publisher:
Cengage Learning

Managerial Economics: Applications, Strategies an…
Economics
ISBN:
9781305506381
Author:
James R. McGuigan, R. Charles Moyer, Frederick H.deB. Harris
Publisher:
Cengage Learning