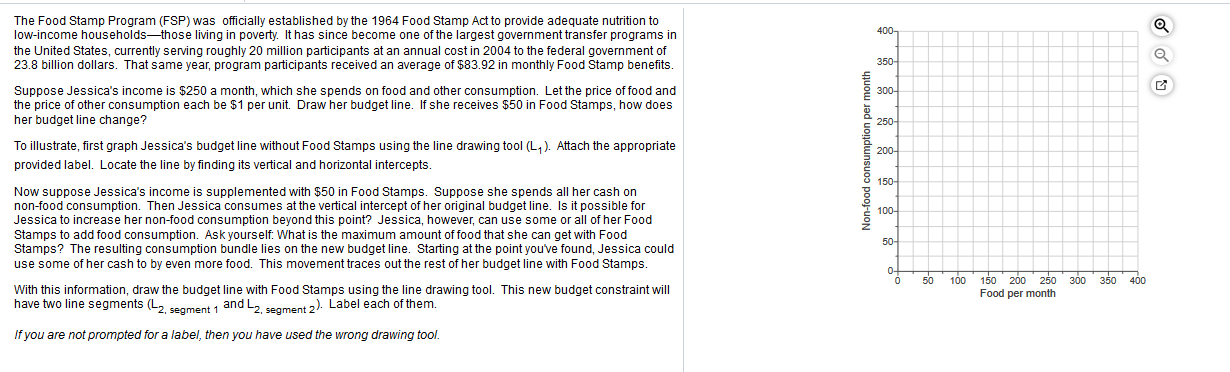
The Food Stamp Program (FSP) was officially established by the 1964 Food Stamp Act to provide adequate nutrition to low-income households-those living in poverty. It has since become one of the largest government transfer programs in 400- the United States, currently serving roughly 20 million participants at an annual cost in 2004 to the federal government of 23.8 billion dollars. That same year, program participants received an average of $83.92 in monthly Food Stamp benefits. 350- Suppose Jessica's income is $250 a month, which she spends on food and other consumption. Let the price of food and the price of other consumption each be $1 per unit. Draw her budget line. If she receives $50 in Food Stamps, how does her budget line change? 300- 250 To illustrate, first graph Jessica's budget line without Food Stamps using the line drawing tool (L,). Attach the appropriate E 200- provided label. Locate the line by finding its vertical and horizontal intercepts. 150- Now suppose Jessica's income is supplemented with $50 in Food Stamps. Suppose she spends all her cash on non-food consumption. Then Jessica consumes at the vertical intercept of her original budget line. Is it possible for Jessica to increase her non-food consumption beyond this point? Jessica, however, can use some or all of her Food Stamps to add food consumption. Ask yourself: What is the maximum amount of food that she can get with Food Stamps? The resulting consumption bundle lies on the new budget line. Starting at the point you've found, Jessica could use some of her cash to by even more food. This movement traces out the rest of her budget line with Food Stamps. 100- 50- 350 400 150 200 250 300 50 100 With this information, draw the budget line with Food Stamps using the line drawing tool. This new budget constraint will have two line segments (L2 sament 1 and L2 senment 2). Label each of them. Food per month If you are not prompted for a label, then you have used the wrong drawing tool. Non-food consumption per month
The Food Stamp Program (FSP) was officially established by the 1964 Food Stamp Act to provide adequate nutrition to low-income households-those living in poverty. It has since become one of the largest government transfer programs in 400- the United States, currently serving roughly 20 million participants at an annual cost in 2004 to the federal government of 23.8 billion dollars. That same year, program participants received an average of $83.92 in monthly Food Stamp benefits. 350- Suppose Jessica's income is $250 a month, which she spends on food and other consumption. Let the price of food and the price of other consumption each be $1 per unit. Draw her budget line. If she receives $50 in Food Stamps, how does her budget line change? 300- 250 To illustrate, first graph Jessica's budget line without Food Stamps using the line drawing tool (L,). Attach the appropriate E 200- provided label. Locate the line by finding its vertical and horizontal intercepts. 150- Now suppose Jessica's income is supplemented with $50 in Food Stamps. Suppose she spends all her cash on non-food consumption. Then Jessica consumes at the vertical intercept of her original budget line. Is it possible for Jessica to increase her non-food consumption beyond this point? Jessica, however, can use some or all of her Food Stamps to add food consumption. Ask yourself: What is the maximum amount of food that she can get with Food Stamps? The resulting consumption bundle lies on the new budget line. Starting at the point you've found, Jessica could use some of her cash to by even more food. This movement traces out the rest of her budget line with Food Stamps. 100- 50- 350 400 150 200 250 300 50 100 With this information, draw the budget line with Food Stamps using the line drawing tool. This new budget constraint will have two line segments (L2 sament 1 and L2 senment 2). Label each of them. Food per month If you are not prompted for a label, then you have used the wrong drawing tool. Non-food consumption per month

Essentials of Economics (MindTap Course List)
8th Edition
ISBN:9781337091992
Author:N. Gregory Mankiw
Publisher:N. Gregory Mankiw
Chapter1: Ten Principles Of Economics
Section: Chapter Questions
Problem 7PA

Related questions
Question
Transcribed Image Text:The Food Stamp Program (FSP) was officially established by the 1964 Food Stamp Act to provide adequate nutrition to
low-income households-those living in poverty. It has since become one of the largest government transfer programs in
400-
the United States, currently serving roughly 20 million participants at an annual cost in 2004 to the federal government of
23.8 billion dollars. That same year, program participants received an average of $83.92 in monthly Food Stamp benefits.
350-
Suppose Jessica's income is $250 a month, which she spends on food and other consumption. Let the price of food and
the price of other consumption each be $1 per unit. Draw her budget line. If she receives $50 in Food Stamps, how does
her budget line change?
300-
250
To illustrate, first graph Jessica's budget line without Food Stamps using the line drawing tool (L,). Attach the appropriate
E 200-
provided label. Locate the line by finding its vertical and horizontal intercepts.
150-
Now suppose Jessica's income is supplemented with $50 in Food Stamps. Suppose she spends all her cash on
non-food consumption. Then Jessica consumes at the vertical intercept of her original budget line. Is it possible for
Jessica to increase her non-food consumption beyond this point? Jessica, however, can use some or all of her Food
Stamps to add food consumption. Ask yourself: What is the maximum amount of food that she can get with Food
Stamps? The resulting consumption bundle lies on the new budget line. Starting at the point you've found, Jessica could
use some of her cash to by even more food. This movement traces out the rest of her budget line with Food Stamps.
100-
50-
350 400
150 200 250 300
50
100
With this information, draw the budget line with Food Stamps using the line drawing tool. This new budget constraint will
have two line segments (L2 sament 1 and L2 senment 2). Label each of them.
Food per month
If you are not prompted for a label, then you have used the wrong drawing tool.
Non-food consumption per month
Expert Solution
This question has been solved!
Explore an expertly crafted, step-by-step solution for a thorough understanding of key concepts.

This is a popular solution!

Trending now
This is a popular solution!

Step by step
Solved in 3 steps with 1 images

Recommended textbooks for you
Essentials of Economics (MindTap Course List)
Economics
ISBN:
9781337091992
Author:
N. Gregory Mankiw
Publisher:
Cengage Learning

Brief Principles of Macroeconomics (MindTap Cours…
Economics
ISBN:
9781337091985
Author:
N. Gregory Mankiw
Publisher:
Cengage Learning

Essentials of Economics (MindTap Course List)
Economics
ISBN:
9781337091992
Author:
N. Gregory Mankiw
Publisher:
Cengage Learning
Brief Principles of Macroeconomics (MindTap Cours…
Economics
ISBN:
9781337091985
Author:
N. Gregory Mankiw
Publisher:
Cengage Learning

Principles of Economics 2e
Economics
ISBN:
9781947172364
Author:
Steven A. Greenlaw; David Shapiro
Publisher:
OpenStax