the given data beloW, form a 95 % confidence interval for the difference between the population mean weight losses for the two diets.
the given data beloW, form a 95 % confidence interval for the difference between the population mean weight losses for the two diets.

Glencoe Algebra 1, Student Edition, 9780079039897, 0079039898, 2018
18th Edition
ISBN:9780079039897
Author:Carter
Publisher:Carter
Chapter10: Statistics
Section10.6: Summarizing Categorical Data
Problem 10CYU

Related questions
Question
100%
STATISTICAL ANALYSIS FOR IE 1
TOPIC: ESTIMATION TWO POPULATIONS
SHOW COMPLETE COMPUTATIONS IN HAND WRITTEN.
THANK YOU
Transcribed Image Text:1.
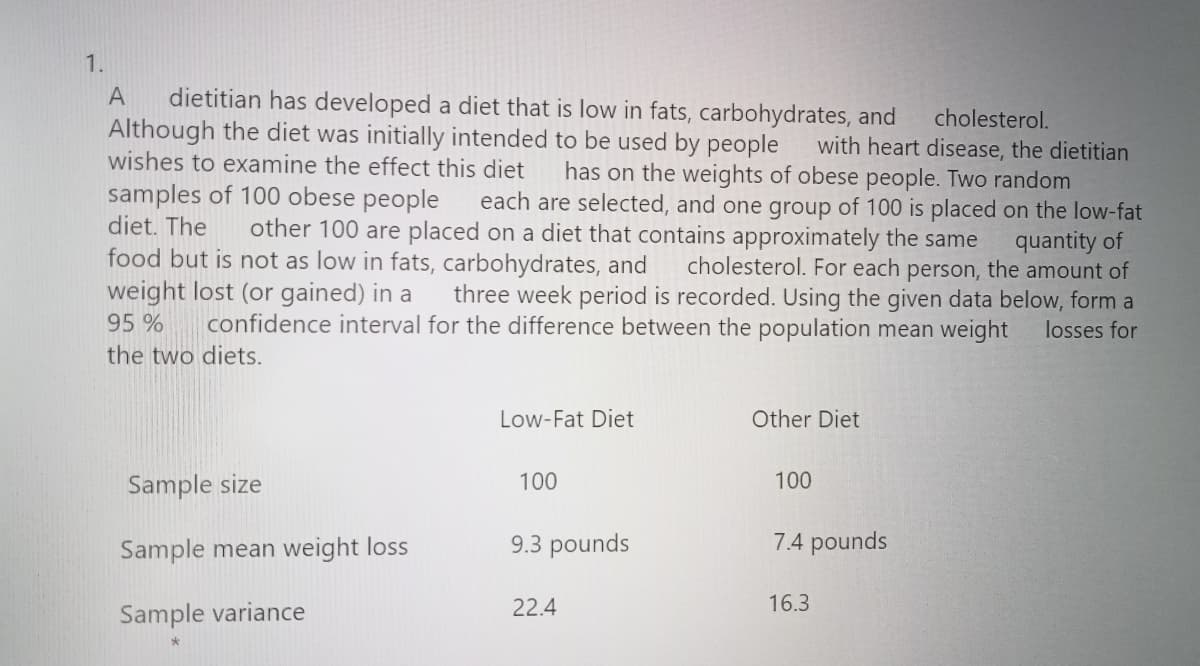
dietitian has developed a diet that is low in fats, carbohydrates, and
Although the diet was initially intended to be used by people
wishes to examine the effect this diet
A
cholesterol.
with heart disease, the dietitian
has on the weights of obese people. Two random
each are selected, and one group of 100 is placed on the low-fat
samples of 100 obese people
diet. The
other 100 are placed on a diet that contains approximately the same
food but is not as low in fats, carbohydrates, and
weight lost (or gained) in a
quantity of
cholesterol. For each person, the amount of
three week period is recorded. Using the given data below, form a
95 %
confidence interval for the difference between the population mean weight
losses for
the two diets.
Low-Fat Diet
Other Diet
Sample size
100
100
Sample mean weight loss
9.3 pounds
7.4 pounds
22.4
16.3
Sample variance
Expert Solution
This question has been solved!
Explore an expertly crafted, step-by-step solution for a thorough understanding of key concepts.

Step by step
Solved in 2 steps with 2 images

Recommended textbooks for you
Glencoe Algebra 1, Student Edition, 9780079039897…
Algebra
ISBN:
9780079039897
Author:
Carter
Publisher:
McGraw Hill

Holt Mcdougal Larson Pre-algebra: Student Edition…
Algebra
ISBN:
9780547587776
Author:
HOLT MCDOUGAL
Publisher:
HOLT MCDOUGAL
Glencoe Algebra 1, Student Edition, 9780079039897…
Algebra
ISBN:
9780079039897
Author:
Carter
Publisher:
McGraw Hill
Holt Mcdougal Larson Pre-algebra: Student Edition…
Algebra
ISBN:
9780547587776
Author:
HOLT MCDOUGAL
Publisher:
HOLT MCDOUGAL