The graph below plots the position versus time for a certain object moving along the x-axis. What is the average velocity over the following time intervals (in m/s)? (Indicate the direction with the signs of your answers.) x (m) 12 10 2 t (s) 4 -2 -4 -6 -8 (a) o to 2.00 s m/s (b) 0 to 4.00 s m/s (c) 2.00 s to 4.00 s m/s
The graph below plots the position versus time for a certain object moving along the x-axis. What is the average velocity over the following time intervals (in m/s)? (Indicate the direction with the signs of your answers.) x (m) 12 10 2 t (s) 4 -2 -4 -6 -8 (a) o to 2.00 s m/s (b) 0 to 4.00 s m/s (c) 2.00 s to 4.00 s m/s

University Physics Volume 1
18th Edition
ISBN:9781938168277
Author:William Moebs, Samuel J. Ling, Jeff Sanny
Publisher:William Moebs, Samuel J. Ling, Jeff Sanny
Chapter3: Motion Along A Straight Line
Section: Chapter Questions
Problem 9CQ: If you divide the total distance traveled on a car trip (as determined by the odometer) by the...

Related questions
Question
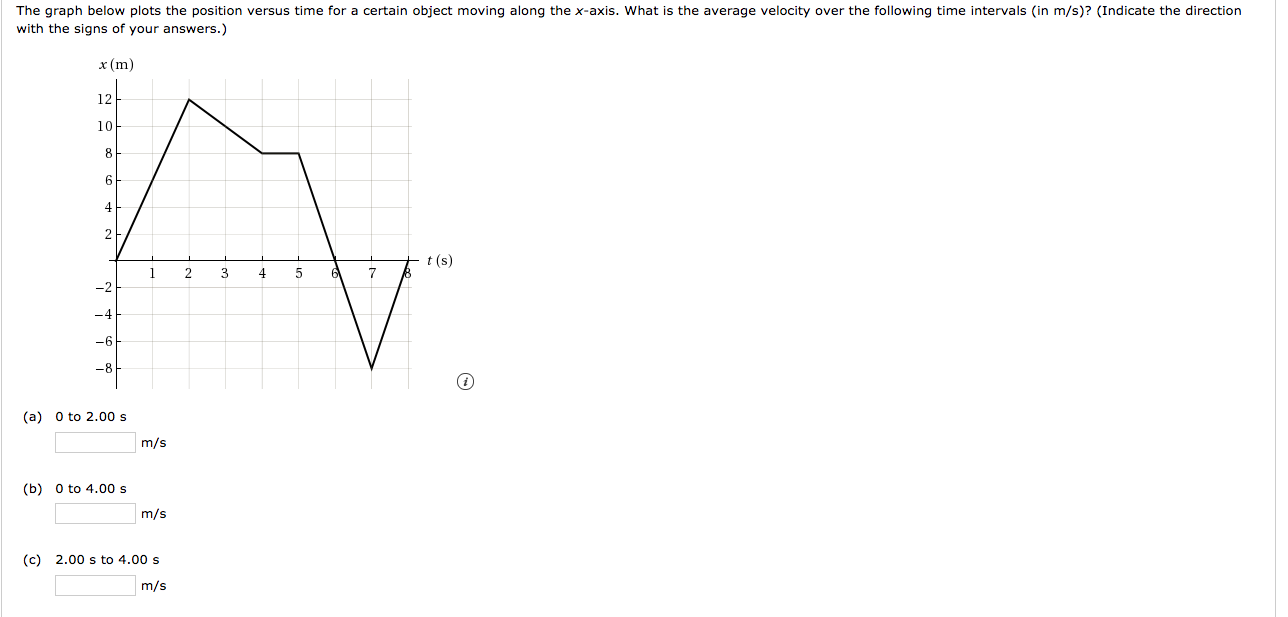
Transcribed Image Text:The graph below plots the position versus time for a certain object moving along the x-axis. What is the average velocity over the following time intervals (in m/s)? (Indicate the direction
with the signs of your answers.)
x (m)
12
10
2
t (s)
4
-2
-4
-6
-8
(a) o to 2.00 s
m/s
(b) 0 to 4.00 s
m/s
(c) 2.00 s to 4.00 s
m/s
Expert Solution
This question has been solved!
Explore an expertly crafted, step-by-step solution for a thorough understanding of key concepts.

This is a popular solution!

Trending now
This is a popular solution!

Step by step
Solved in 4 steps with 4 images

Recommended textbooks for you
University Physics Volume 1
Physics
ISBN:
9781938168277
Author:
William Moebs, Samuel J. Ling, Jeff Sanny
Publisher:
OpenStax - Rice University
University Physics Volume 1
Physics
ISBN:
9781938168277
Author:
William Moebs, Samuel J. Ling, Jeff Sanny
Publisher:
OpenStax - Rice University