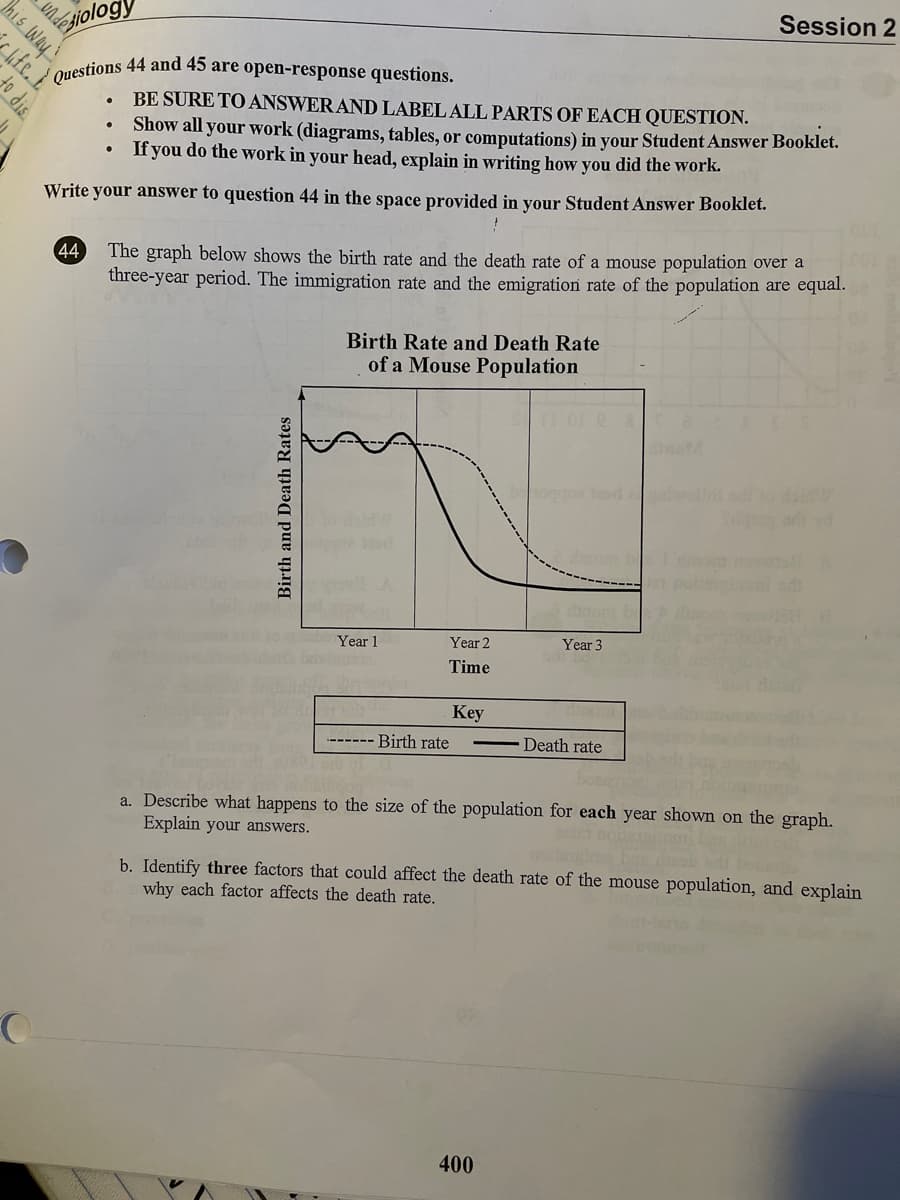
The graph below shows the birth rate and the death rate of a mouse population over a three-year period. The immigration rate and the emigration rate of the population are equal. Birth Rate and Death Rate of a Mouse Population Year 1 Year 2 Year 3 Time Key Birth rate Death rate -- a. Describe what happens to the size of the population for each year shown on the graph. Explain your answers. b. Identify three factors that could affect the death rate of the mouse population, and explain why each factor affects the death rate. Birth and Death Rates
The graph below shows the birth rate and the death rate of a mouse population over a three-year period. The immigration rate and the emigration rate of the population are equal. Birth Rate and Death Rate of a Mouse Population Year 1 Year 2 Year 3 Time Key Birth rate Death rate -- a. Describe what happens to the size of the population for each year shown on the graph. Explain your answers. b. Identify three factors that could affect the death rate of the mouse population, and explain why each factor affects the death rate. Birth and Death Rates

Chapter19: Child Health
Section: Chapter Questions
Problem H1CRE

Related questions
Question
Transcribed Image Text:Session 2
siology
Questions 44 and 45 are open-response questions.
to dis.
BE SURE TO ANSWER AND LABEL ALL PARTS OF EACH QUESTION.
Show all your work (diagrams, tables, or computations) in your Student Answer Booklet.
If you do the work in your head, explain in writing how you did the work.
Write your answer to question 44 in the space provided in your Student Answer Booklet.
44
The graph below shows the birth rate and the death rate of a mouse population over a
three-year period. The immigration rate and the emigration rate of the population are equal.
Birth Rate and Death Rate
of a Mouse Population
ogg td e
odr
Year 1
Year 2
Year 3
Time
Key
------ Birth rate
Death rate
a. Describe what happens to the size of the population for each year shown on the graph.
Explain your answers.
b. Identify three factors that could affect the death rate of the mouse population, and explain
why each factor affects the death rate.
400
This Way
slife.
Birth and Death Rates
Expert Solution
This question has been solved!
Explore an expertly crafted, step-by-step solution for a thorough understanding of key concepts.

This is a popular solution!

Trending now
This is a popular solution!

Step by step
Solved in 2 steps

Knowledge Booster


Learn more about
Need a deep-dive on the concept behind this application? Look no further. Learn more about this topic, biology and related others by exploring similar questions and additional content below.Recommended textbooks for you
Essentials Health Info Management Principles/Prac…
Health & Nutrition
ISBN:
9780357191651
Author:
Bowie
Publisher:
Cengage
Understanding Health Insurance: A Guide to Billin…
Health & Nutrition
ISBN:
9781337679480
Author:
GREEN
Publisher:
Cengage
Essentials Health Info Management Principles/Prac…
Health & Nutrition
ISBN:
9780357191651
Author:
Bowie
Publisher:
Cengage
Understanding Health Insurance: A Guide to Billin…
Health & Nutrition
ISBN:
9781337679480
Author:
GREEN
Publisher:
Cengage
Case Studies In Health Information Management
Biology
ISBN:
9781337676908
Author:
SCHNERING
Publisher:
Cengage