The graph below shows the Laffer Curve. Using the point drawing tool, identify a tax rateltax revenue combination such that tax rates can be reduced without reducing tax revenues. Label your new point T, Carefully follow the instructions above, and only draw the required object. Tax Rate Tax Revenues
The graph below shows the Laffer Curve. Using the point drawing tool, identify a tax rateltax revenue combination such that tax rates can be reduced without reducing tax revenues. Label your new point T, Carefully follow the instructions above, and only draw the required object. Tax Rate Tax Revenues

Chapter22: The Public Sector
Section: Chapter Questions
Problem 10SQP

Related questions
Question
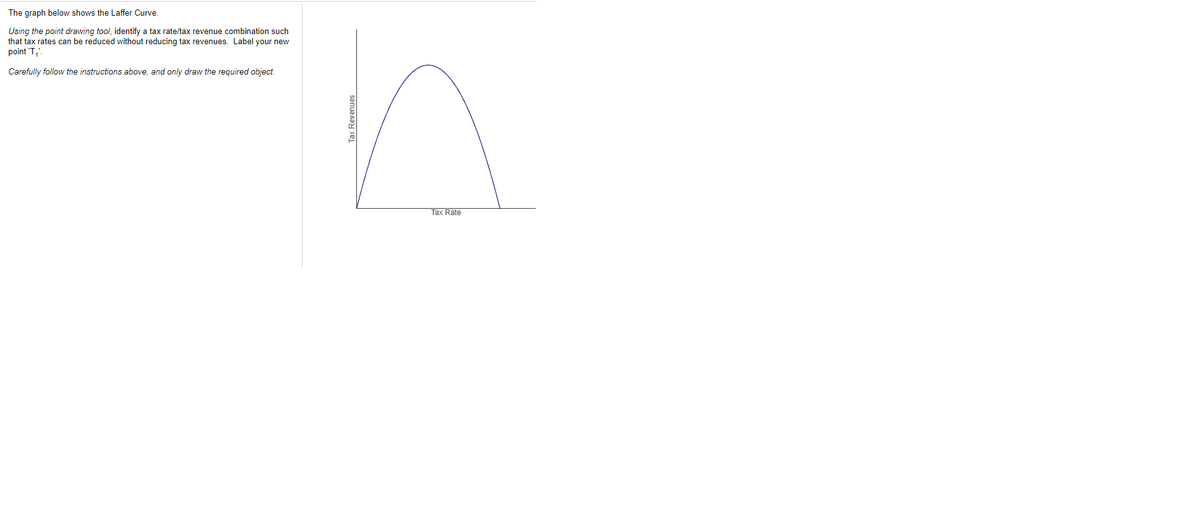
Transcribed Image Text:The graph below shows the Laffer Curve,
Using the point drawing tool, identify a tax rate/tax revenue combination such
that tax rates can be reduced without reducing tax revenues. Label your new
point 'T,'
Carefully follow the instructions above, and only draw the required object.
Tax Rate
Tax Revenues
Expert Solution
This question has been solved!
Explore an expertly crafted, step-by-step solution for a thorough understanding of key concepts.

This is a popular solution!

Trending now
This is a popular solution!

Step by step
Solved in 2 steps with 1 images

Knowledge Booster


Learn more about
Need a deep-dive on the concept behind this application? Look no further. Learn more about this topic, economics and related others by exploring similar questions and additional content below.Recommended textbooks for you


Macroeconomics: Private and Public Choice (MindTa…
Economics
ISBN:
9781305506756
Author:
James D. Gwartney, Richard L. Stroup, Russell S. Sobel, David A. Macpherson
Publisher:
Cengage Learning

Economics: Private and Public Choice (MindTap Cou…
Economics
ISBN:
9781305506725
Author:
James D. Gwartney, Richard L. Stroup, Russell S. Sobel, David A. Macpherson
Publisher:
Cengage Learning

Microeconomics: Principles & Policy
Economics
ISBN:
9781337794992
Author:
William J. Baumol, Alan S. Blinder, John L. Solow
Publisher:
Cengage Learning