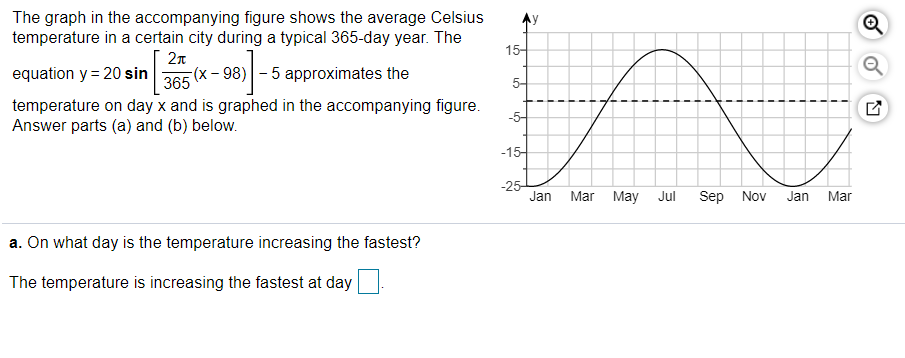
The graph in the accompanying figure shows the average Celsius temperature in a certain city during a typical 365-day year. The 15- equation y = 20 sin - 98) - 5 approximates the 365 (x- 5- temperature on day x and is graphed in the accompanying figure. Answer parts (a) and (b) below. -5- -15- -25- Jan Mar May Jul Sep Nov Jan Mar
The graph in the accompanying figure shows the average Celsius temperature in a certain city during a typical 365-day year. The 15- equation y = 20 sin - 98) - 5 approximates the 365 (x- 5- temperature on day x and is graphed in the accompanying figure. Answer parts (a) and (b) below. -5- -15- -25- Jan Mar May Jul Sep Nov Jan Mar

College Algebra (MindTap Course List)
12th Edition
ISBN:9781305652231
Author:R. David Gustafson, Jeff Hughes
Publisher:R. David Gustafson, Jeff Hughes
Chapter5: Exponential And Logarithmic Functions
Section5.2: Applications Of Exponential Functions
Problem 47E

Related questions
Question
On what day is the temperature increasing the fastest?
Transcribed Image Text:The graph in the accompanying figure shows the average Celsius
temperature in a certain city during a typical 365-day year. The
15-
2n
equation y = 20 sin
(x - 98) - 5 approximates the
365
5-
temperature on day x and is graphed in the accompanying figure.
Answer parts (a) and (b) below.
-5-
-15-
-25-
Jan
Jul
Mar
May
Sep Nov
Jan
Mar
a. On what day is the temperature increasing the fastest?
The temperature is increasing the fastest at day
Expert Solution
This question has been solved!
Explore an expertly crafted, step-by-step solution for a thorough understanding of key concepts.

This is a popular solution!

Trending now
This is a popular solution!

Step by step
Solved in 2 steps

Knowledge Booster


Learn more about
Need a deep-dive on the concept behind this application? Look no further. Learn more about this topic, calculus and related others by exploring similar questions and additional content below.Recommended textbooks for you
College Algebra (MindTap Course List)
Algebra
ISBN:
9781305652231
Author:
R. David Gustafson, Jeff Hughes
Publisher:
Cengage Learning

Algebra & Trigonometry with Analytic Geometry
Algebra
ISBN:
9781133382119
Author:
Swokowski
Publisher:
Cengage

College Algebra (MindTap Course List)
Algebra
ISBN:
9781305652231
Author:
R. David Gustafson, Jeff Hughes
Publisher:
Cengage Learning
Algebra & Trigonometry with Analytic Geometry
Algebra
ISBN:
9781133382119
Author:
Swokowski
Publisher:
Cengage