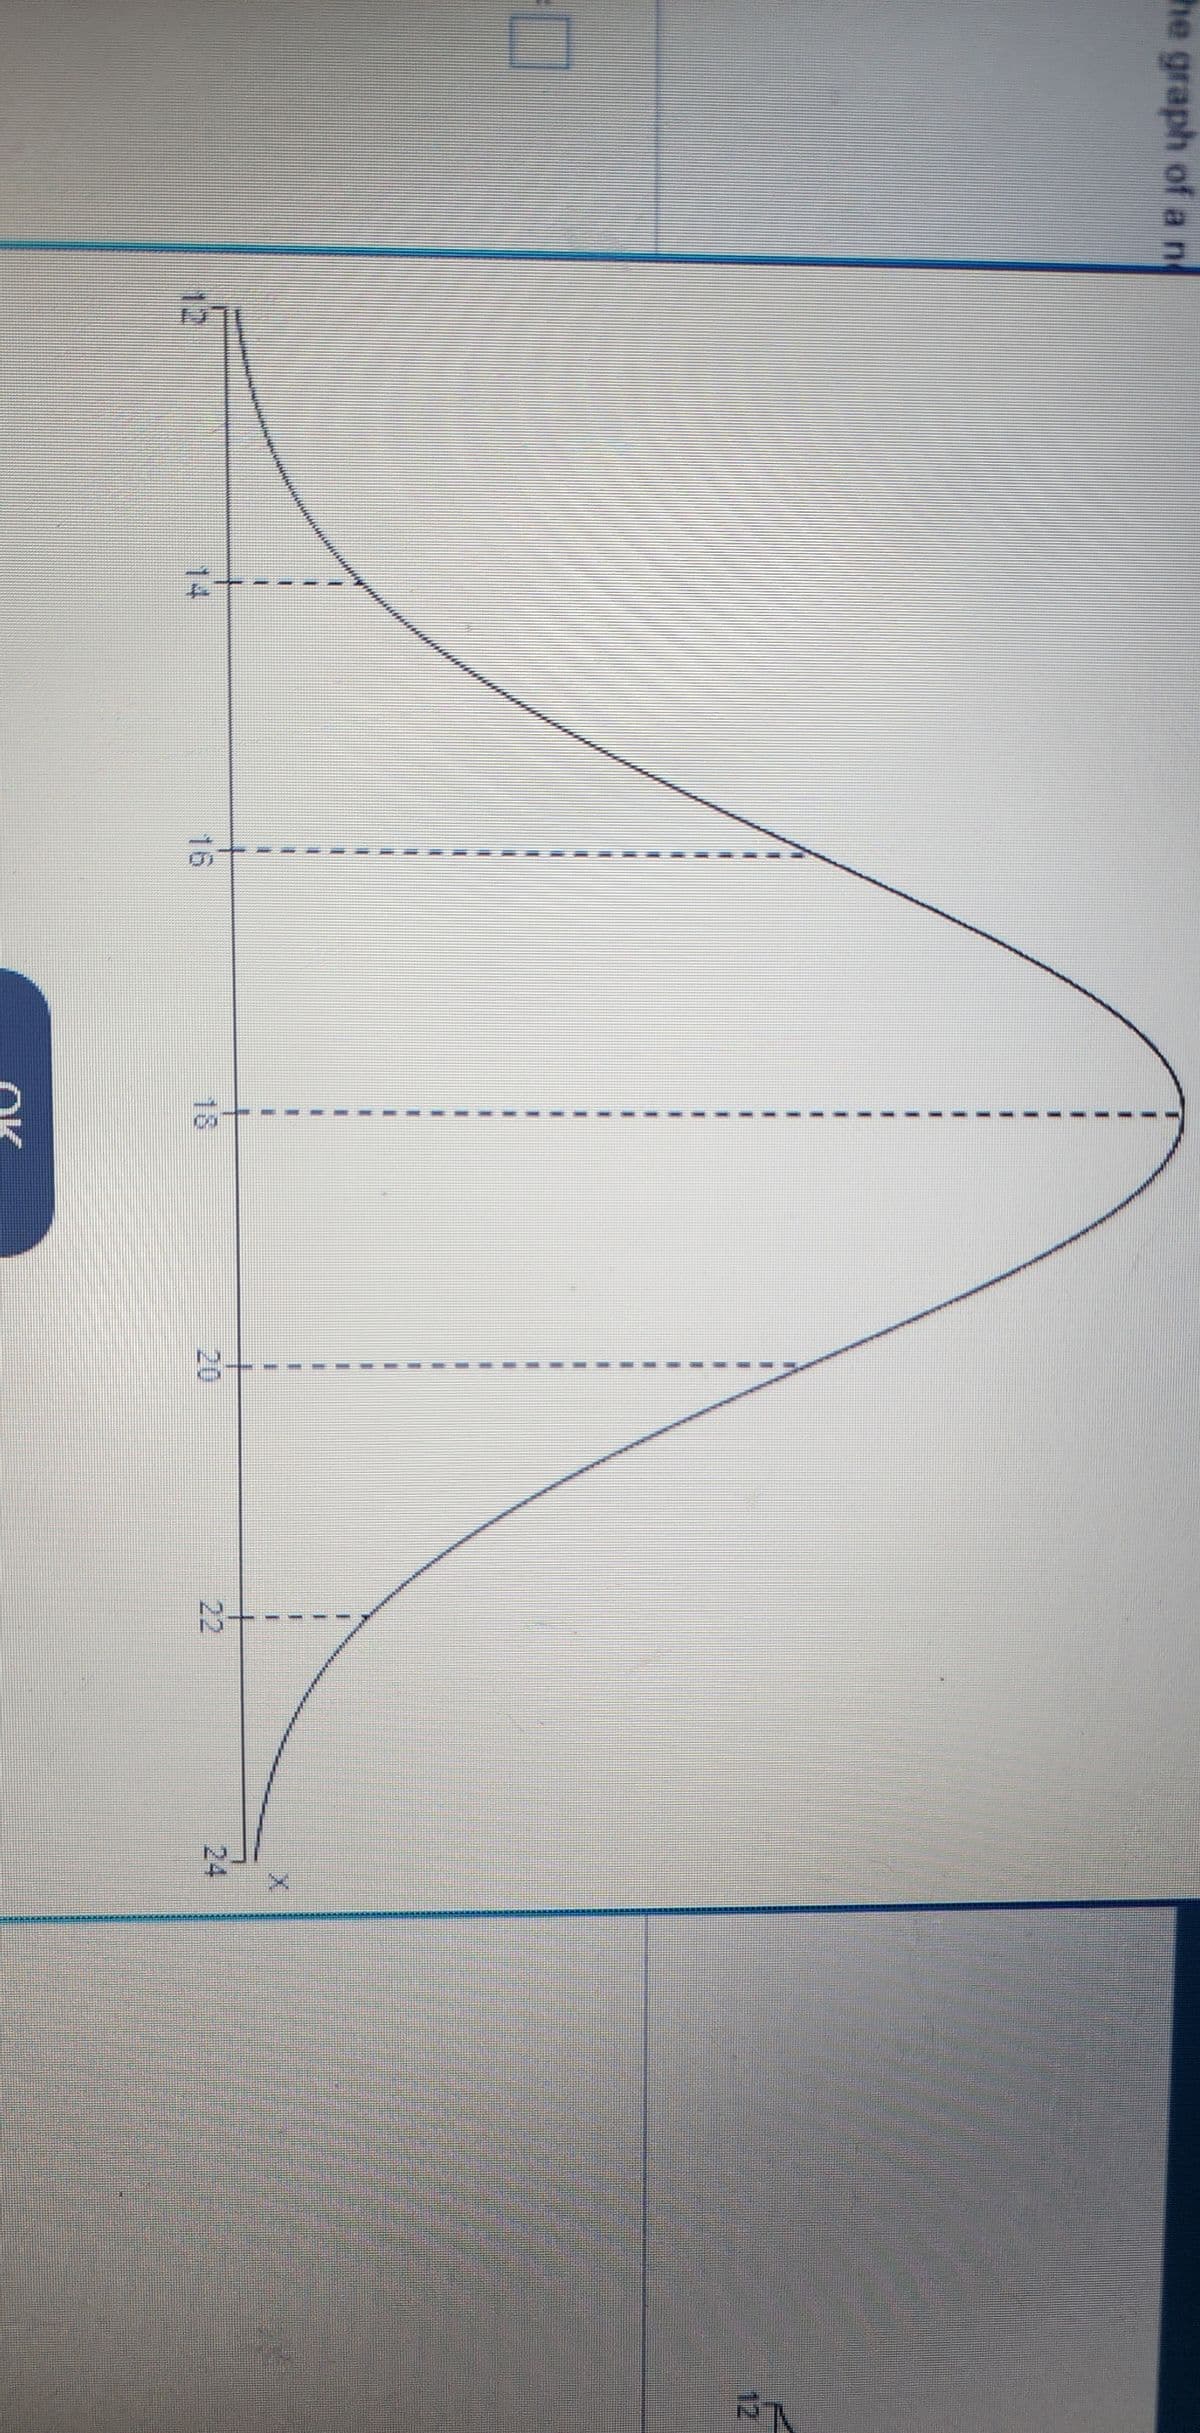
The graph of a normal curve is given on the right. Use the graph to identify the values of μ and σ.
Q: A die is rolled nine times, and the number of times at two shows on the upper face is counted. If…
A: given data roll adie nine times count number of times two shows up repeat this experiment many times…
Q: Let Y₁, Y2, Y3, Y4, Y5 be a random sample of size 5 from a standard normal population. Find the…
A: Solution
Q: (3) Look at the boxplot below, which shows data for the selling price of homes in a certain…
A: Given that Using the given Box Plot we have to find a.. What was the typical selling price? b.…
Q: Based on the data below, what is the z-score for a score of 91? 89 86 88 90 90 91 87 89 91 89 87 85…
A: The given data set is, The no.of observations are, n = 70
Q: Quality control: A population of 610 semiconductor wafers contains wafers from three lots. The…
A: Note: If the post contains multiple subparts only allow to do first 3 subparts as per guidelines of…
Q: The required sample size is (Round up to the nearest whole number as needed.) Does the sample size…
A:
Q: 3. Students are asked to count the number of chocolate chips in 22 cookies for a class activity.…
A: Standard error measure the variability in the mean of the sample. It is the combined value of…
Q: 6.4 a. Find the mean b. Find the median. c. Find the mode. 6.7 7 OF 16 15. A teacher gave a quiz to…
A: data of a teacher gave a quiz to his economics classstudent score .....73,82,64,61,63,52,73,70here…
Q: Here is a timeplot of each monthly load factor for domestic flights for 2002 to 2017 along with a…
A:
Q: company claims that the percentage test that claim
A: Given data,n = 100 colored cardidesselection of 100 coloured 21% of the blue, perecntage of blue…
Q: i) Find C. Scanned with CamScanner ii) Find P≤X<- 2 —
A: It is given that a random variable X with pdf fX(x) = { Cx(1-x), 0≤x≤1 0,…
Q: For a recent English exam, use the Normal model N(73, 9.2) to find the proportion of scores under…
A: From the provided information. Mean (x) = 73 And standard deviation (s) = 9.2 Let Y be a random…
Q: An investment counselor calls with a hot stock tip. He believes that if the economy remains strong,…
A: It is given that an economist who believes there is a 20% probability the economy will remain…
Q: 1. Heights Heights of adult males are normally distributed. If a large sample of heights adult males…
A: Hi there! Since there are multiple questions, we will solve the first question for you. To get the…
Q: 7.16 In 120 were ob Numi
A: Question 7.16 Given,
Q: briefly discuss a method of data analysis
A: The method of Data Analysis is as follows
Q: Quality control: A population of 610 semiconductor wafers contains wafers from three lots. The…
A: As per bartleby guideline expert have to answer first three subpart only.
Q: a. Express the original claim in symbolic form. Let the parameter represent a value with respect to…
A: Given: sample size, n=292 Sample mean, x¯=120.86 Sample standard deviation, s=14.88
Q: Suppose that a random sample X₁, X2, X20 follows an exponential distribution with ..., parameter B.…
A: i=1,2,3,...,20
Q: EXAMINING THE RELATIONSHIPS BETWEEN VARIABLES:CHI SQUARED TEST (1) A study has been made of five…
A: Since you have posted a question with multiple sub-parts, we will solve first three subparts for…
Q: A clothing business finds there is a linear relationship between the number of shirts,n, it can sell…
A: Given that n1 =23000,p1 =55 n2 = 31000 , p2 = 39 P =?
Q: 2, 3, 6, 8, 9 1. find the range 2. Use the defining formula to compute the sample standard…
A: Introduction: A summary statistic that captures a dataset's degrees of displacement is considered a…
Q: Five men out of 100 and 25 women out of 100 are colour blind. A colour blind person is chosen at…
A:
Q: In your biology class, your final grade is based on several things: a lab score, scores on two major…
A: Formula for weighted average is as follows : Weighted average = Number ×Weighted factorSum of the…
Q: Pay your bills: In a large sample of customer accounts, a utility company determined that the…
A: a) Suppose a random variable X defines the number of days between when a bill was sent out and when…
Q: Stem (hundred thousands) Leaf (ten thousands) 1 46667789 2 3 4 s The stem-and-leaf plot above shows…
A:
Q: What is the probability that a randomly selected 45- to 48-year-old mother who had a live birth in…
A: Graph for the discrete probability distribution is given. It represents the all possible values of X…
Q: The accompanying table describes results from groups of 8 births from 8 different sets of parents.…
A: a. The probability distribution table of 6 girls in 8 births is given.
Q: Let X be a random variable such that a. V(3x-3) b. E(3x-3) E(X²) = 58 and V(X) = 40. Compute
A: Answer:- Given, X be a random variable such that E(X2) = 58 and V(X) = 40 (a) Find…
Q: At Center Hospital there is some concern about the high turnover of nurses. A survey was done to…
A:
Q: ata by the rest of the brain, particu scale up with the size of animals' sented differentially…
A: You can use a statistical technique called simple linear regression to comprehend the relationship…
Q: 21. Cigarettes 2009 In 1999, the Centers for Disease Con- trol and Prevention estimated that about…
A: Since you have posted a question with multiple sub-parts, we will solve first three subparts for…
Q: (a) Compute the mean and standard deviation of the random variable X, the number of smokers who…
A: Given, According to an almanac, 70% of adult smokers started smoking before turning 18 years old.…
Q: For a standard normal distribution, find: P(Z > c) = 0.9894 Find c rounded to two decimal places.
A: given data standard normal distribution:Z~N(0,1)P(Z>C) = 0.9894we have to find value of C=?
Q: Time to review: The following table presents the time taken to review articles that were submitted…
A: Given data :
Q: Please help me do this case study with explanations with the answers and the calculations on excel…
A: The customers' ratings of the product have mean μ=80. The ratings have a standard deviation σ=25.…
Q: Suppose that a poll taken 10 years ago found that 55% of parents spank their children. Suppose a…
A: given data 10 years ago;P(parents spank their children)= p = 0.55 recent poll ; n = 350, x= 165 x…
Q: Find the population variance and standard deviation for the following population. Round the answers…
A: Answer: - Given data 17, 7, 18, 7, 24, 21 Find the population variance…
Q: d. What percent of the students spent no more than 40 minutes on social media? 0% Round to two…
A:
Q: The quantile function function of T: is defined using the inverse cdt of Y as a Q(T) = F-¹(T) =…
A: quantile function tells us probability of the variable being less than or equal to that value equals…
Q: and operate Medical researchers have developed a new artificial heart constructed primarily of…
A:
Q: Use probability distribution to complete parts a and b the number of defects per 1000 machine…
A: Given that: Defects 0 1 2 3 4 5 probability 0.264 0.299 0.236 0.142 0.041 0.018
Q: A sample of 100 provided a sample mean of 77.5. The population standard deviation is known to be 15.…
A: It is given that Population mean, μ = 80 Sample mean, x̄ = 77.5 Population standard deviation, σ =…
Q: You have 5 quarters, 5 dimes, and 7 pennies in a wallet. Suppose two coins are to be selected at…
A:
Q: 74,34,65,45,87,67,98,67,55,32,23 Find the mean and median?
A: Data given 74,34,65,45,87,67,98,67,55,32,23 n=11
Q: ㅏ 11 12 13 14 15 16 17 18 19 20 21 22 23 24 25 26 27 28 29 30 data a Based on the boxplot above,…
A: The boxplot is given.
Q: 13. September 22 is the birth date of Kim Hyo-Yeon, a singer with the South Korean girl group Girls'…
A: Given information: Sample size (n)=129 Based on the sample box plot is given. Find: Question 13.…
Q: Based on a sample of 30 randomly selected years, a 90% confidence interval for the mean annual…
A: Given;a 90% confidence interval for the mean annual preciptation in one city is from 123.7 cm to…
Q: Let S denote the sample variance for a random sample of ten In(LC50) values for copper and let S…
A:
Q: For two sets A and B, an element d belonging to AUB cannot belong to An B. O True False
A: Given statement;For two sets A and B, an element d belonging to A∪B cannot belong to A∩B.
The graph of a normal curve is given on the right. Use the graph to identify the values of
Trending now
This is a popular solution!
Step by step
Solved in 2 steps with 2 images